
GAC sales are up 145.1% year-on-year in August. 4,549 new cars hit Singaporean roads in…
Singapore September 2026: BYD, Tesla, Chery, GAC defy negative market, Chinese at 52.9% share
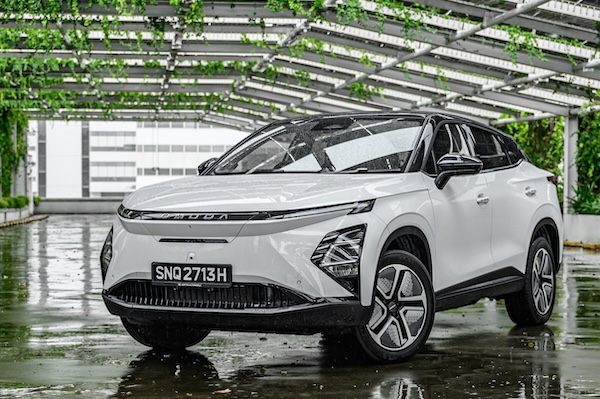 Chery sales double year-on-year in September.
New car sales in Singapore drop -7.7% year-on-year in September to 4,340 units, however the year-to-date tally remains in positive at +8% to 40,986. At 26.4% of the market, BYD (+13.8%) defies the negative market and hits its highest share since last April (30.7% which remains a record). Tesla (+14.7%) stays in 2nd place with 9.4% share which is below the 10.1% it commands year-to-date. Toyota (-40.3%) freefalls to 8.9% ahead of Mercedes (-19.3%) and Honda (-43.2%) both also sinking hard. In contrast Chery (+100%) and GAC (+84.1%) surge ahead to #6 and #7 respectively. Xpeng (+82%) and MG (+59.6%) also make it into the Top 10 like last month. Below, AvatR (+533.3%) and Maxus (+160.9%) stand out. All in all, Chinese carmakers hold 52.9% of the Singaporean market vs. 35.5% a year ago in September 2025 thanks to sales up 37.5%. This is the second highest Chinese share below the 55.5% reach last April.
Previous month: Singapore August 2026: GAC at all-time high, Chinese at 51.7% share
One year ago: Singapore September 2025: BYD hits record 21.4% share, Zeekr breaks into Top 10
Full September 2026 Top 48 All brands ranking below.
Singapore September 2026 – brands:
| Pos | Brand | Sep-26 | % | /25 | Aug | 2026 | % | /25 | Pos | FY25 |
| 1 | BYD | 1,145 | 26.4% | + 13.8% | 1 | 10,173 | 24.8% | + 36.1% | 1 | 1 |
| 2 | Tesla | 406 | 9.4% | + 14.7% | 2 | 4,129 | 10.1% | + 65.8% | 3 | 6 |
| 3 | Toyota (incl Lexus) | 388 | 8.9% | – 40.3% | 3 | 4,800 | 11.7% | – 11.9% | 2 | 2 |
| 4 | Mercedes | 242 | 5.6% | – 19.3% | 4 | 2,542 | 6.2% | – 32.1% | 4 | 4 |
| 5 | Honda | 214 | 4.9% | – 43.2% | 8 | 1,911 | 4.7% | – 46.4% | 6 | 5 |
| 6 | Chery | 200 | 4.6% | + 100.0% | 9 | 1,853 | 4.5% | + 297.6% | 7 | 16 |
| 7 | GAC | 197 | 4.5% | + 84.1% | 5 | 1,549 | 3.8% | + 103.3% | 9 | 11 |
| 8 | BMW | 187 | 4.3% | – 60.0% | 6 | 2,218 | 5.4% | – 44.4% | 5 | 3 |
| 9 | Xpeng | 182 | 4.2% | + 82.0% | 10 | 1,246 | 3.0% | + 98.1% | 10 | 12 |
| 10 | MG | 174 | 4.0% | + 59.6% | 7 | 1,593 | 3.9% | + 139.9% | 8 | 13 |
| 11 | Zeekr | 129 | 3.0% | – 18.4% | 11 | 1,104 | 2.7% | + 189.0% | 11 | 14 |
| 12 | Nissan | 100 | 2.3% | + 16.3% | 12 | 858 | 2.1% | – 1.6% | 12 | 10 |
| 13 | Mazda | 78 | 1.8% | – 26.4% | 14 | 459 | 1.1% | – 49.3% | 16 | 8 |
| 14 | Kia | 77 | 1.8% | – 18.1% | 13 | 735 | 1.8% | – 21.1% | 13 | 9 |
| 15 | Porsche | 63 | 1.5% | – 14.9% | 20 | 449 | 1.1% | – 10.7% | 18 | 17 |
| 16 | Maxus | 60 | 1.4% | + 160.9% | 15 | 479 | 1.2% | + 219.3% | 15 | 26 |
| 17 | AvatR | 57 | 1.3% | + 533.3% | 16 | 418 | 1.0% | + 1717.4% | 21 | 31 |
| 18 | Volvo | 49 | 1.1% | – 33.8% | 19 | 454 | 1.1% | – 9.2% | 17 | 18 |
| 19 | Audi | 45 | 1.0% | – 44.4% | 18 | 442 | 1.1% | – 15.6% | 19 | 15 |
| 20 | Leapmotor | 40 | 0.9% | new | 22 | 294 | 0.7% | new | 24 | 35 |
| 21 | Subaru | 39 | 0.9% | – 27.8% | 17 | 405 | 1.0% | – 13.3% | 22 | 19 |
| 22 | Hyundai | 33 | 0.8% | – 68.9% | 26 | 505 | 1.2% | – 55.3% | 14 | 7 |
| 23 | Dongfeng | 30 | 0.7% | + 57.9% | 24 | 440 | 1.1% | + 100.9% | 20 | 22 |
| 24 | Deepal | 29 | 0.7% | + 61.1% | 21 | 284 | 0.7% | + 212.1% | 25 | 28 |
| 25 | Suzuki | 29 | 0.7% | + 93.3% | 23 | 312 | 0.8% | + 17.3% | 23 | 21 |
| 26 | Geely | 24 | 0.6% | + 140.0% | 25 | 241 | 0.6% | + 1908.3% | 26 | 37 |
| 27 | Volkswagen | 24 | 0.6% | – 35.1% | 29 | 176 | 0.4% | – 62.6% | 27 | 20 |
| 28 | Great Wall | 21 | 0.5% | + 133.3% | 27 | 81 | 0.2% | – 5.8% | 31 | 29 |
| 29 | Skoda | 20 | 0.5% | – 16.7% | 30 | 107 | 0.3% | – 57.9% | 29 | 23 |
| 30 | Mini | 11 | 0.3% | – 64.5% | 31 | 149 | 0.4% | – 32.0% | 28 | 24 |
| 31 | Land Rover | 7 | 0.2% | – 84.4% | 34 | 95 | 0.2% | – 40.6% | 30 | 25 |
| 32 | Polestar | 5 | 0.1% | – 58.3% | 35 | 59 | 0.1% | – 52.8% | 33 | 27 |
| 33 | NIO | 4 | 0.1% | new | 33 | 44 | 0.1% | new | 35 | 59 |
| 34 | Proton | 4 | 0.1% | n/a | – | 4 | 0.0% | n/a | 53 | – |
| 35 | Cupra | 3 | 0.1% | – 57.1% | 37 | 30 | 0.1% | + 0.0% | 37 | 34 |
| 36 | Alfa Romeo | 2 | 0.0% | n/a | 36 | 12 | 0.0% | + 300.0% | 42 | 47 |
| 37 | Bentley | 2 | 0.0% | + 100.0% | – | 10 | 0.0% | – 41.2% | 45 | 39 |
| 38 | Ferrari | 2 | 0.0% | + 0.0% | 38 | 14 | 0.0% | – 26.3% | 41 | 40 |
| 39 | Ford | 2 | 0.0% | n/a | – | 3 | 0.0% | + 0.0% | 54 | 52 |
| 40 | Hongqi | 2 | 0.0% | new | 32 | 40 | 0.1% | new | 36 | – |
| 41 | Jaguar | 2 | 0.0% | n/a | 39 | 24 | 0.1% | + 118.2% | 38 | 43 |
| 42 | Jeep | 2 | 0.0% | n/a | 42 | 11 | 0.0% | + 37.5% | 44 | 48 |
| 43 | Lotus | 2 | 0.0% | + 100.0% | 43 | 8 | 0.0% | – 50.0% | 48 | 41 |
| 44 | Maserati | 2 | 0.0% | + 0.0% | 44 | 17 | 0.0% | – 51.4% | 40 | 36 |
| 45 | Opel | 2 | 0.0% | – 66.7% | – | 73 | 0.2% | + 43.1% | 32 | 32 |
| 46 | Smart | 2 | 0.0% | – 66.7% | 28 | 56 | 0.1% | + 16.7% | 34 | 33 |
| 47 | Aston Martin | 1 | 0.0% | n/a | – | 4 | 0.0% | + 33.3% | 51 | 53 |
| 48 | Rolls Royce | 1 | 0.0% | + 0.0% | 40 | 10 | 0.0% | – 23.1% | 46 | 46 |
Source: LTA

Related Posts
Comments (0)