
The VW T-Roc is the best-selling vehicle in Europe in August. Dataforce has the European…
Europe September 2026: Tesla (+71.1%) breaks records, signs 1-2, Chinese up 113.2%
 The Tesla Model Y is the best-selling vehicle in Europe in September and YTD.
Dataforce has the European market (EU+EFTA+UK) up a solid 10.2% year-on-year in September to 1,343,518 units, leading to a year-to-date volume up 6.1% to 10,561,734. ACEA’s numbers are 1,363,210 (+10.2%) for the month and 10,555,351 (+6.3%) year-to-date. This month as usual the market is skewed towards the UK as it corresponds to the bi-annual licence plate change. This way, sales in the UK are up 12% to 350,536, Germany is up 9% to 256,774, France up 11.6%, Italy up 9.8% and Spain up 10.8%. Other great performing markets include Estonia (+41.1%), Norway (+30.7%), Hungary (+20.3%), Malta (+15.6%) and Portugal (+15.2%). At the other end of the scale, struggling markets are Cyprus (-16.6%), Romania (-11.2%), Czechia (-10.6%), Latvia (-9.5%) and Luxembourg (-6.4%).
 The Tesla Model 3 ranks #2 in Europe this month.
BEV sales are up 59.9% to 416,443 units and 30.5% share vs. 21.1% a year ago in September 2025. Year-to-date, BEVs are up 41.9% to 2,549,810 and 24.2% share vs. 18.1% over the same period last year. The biggest BEV markets for September are the UK at 99,201 (+36.3%), Germany at 88,599 (+94.7%), France at 65,243 (+107.5%), the Netherlands at 19,149 (+58.5%), Norway at 18,511 (+31.4%), Denmark at 17,784 (+36.9%) and Spain at 17,366 (+71.7%). Strong BEV growth is also recorded in Estonia (+173.5%), Bulgaria (+151.8%), Slovakia (+126.5%), Portugal (+87.4%), Latvia (+87.4%), Austria (+80.6%), Ireland (+79.6%), Finland (+67.4%), Slovenia (+65%), Greece (+59.5%), Czechia (+57.4%), Switzerland (+51.2%) and Sweden (+45.9%).
Looking at the OEM ranking, it is Tesla and the Chinese that almost single-handedly pull the market up. Indeed the VW Group (-2.8%), Renault Group (-0.8%) and Hyundai-Kia (-2.7%) are all down, the BMW Group is stable and Stellantis (+5.1%), Mercedes (+4%) and the Toyota Group (+1.1%) all trail the market. Tesla (+71.1%) climbs 5 spots on August to #8 while Leapmotor (+324.2%), the Chery Group (+187.3%), BYD Auto (+102.4%), the Geely Group (+31.3%) and SAIC Motor (+24.4%) all surge ahead.
 The Jaecoo 7 breaks into the European Top 10.
Brand-wise, Volkswagen (-4.8%) goes against the positive market, followed by Toyota (+0.2%) and Skoda (+0.5%), both stable. Mercedes (+4%) and Renault (+4.6%) are more dynamic yet can’t catch up with the market growth, they both pass BMW (-1.3%), in difficulty. In contrast Tesla (+71.1%) shoots up #7 but ends the month less than 1,000 sales from 4th place overall. This is a record ranking, also hit in December 2022 and only the third time the American brand ranks inside the European Top 10 (add December 2024 at #10). It smashes its volume record at just over 66,000 sales (previous best: 60,956 in March 2023).
Kia (+11.6%) is the only additional Top 10 member to beat the market, with Peugeot (+1.4%) in positive but Audi (-3.4%) struggling. Meanwhile BYD (+102.3%) reaches a record ranking (#11, previous best #13 last May, July and August) and volume ranking (49,340, previous best 38,655 last June). 52% of its September volume comes from the UK where it ranks #2. Below, Jaecoo (+156.6%), Fiat (+23.7%), Mazda (+23.5%) and Citroen (+21.2%) shine, while further down Geely (+3610.2%), Chery (+688.8%), Leapmotor (+324.2%) and Omoda (+110.6%) illustrate the Chinese charge. All in all, Chinese carmakers see their sales surge 113.9% year-on-year for the month to 182,462 and 13.6% share vs. 7% a year ago and up 113.2% year-to-date to 1,023,762 units and 9.7% share vs. 4.8% over the same period in 2025.
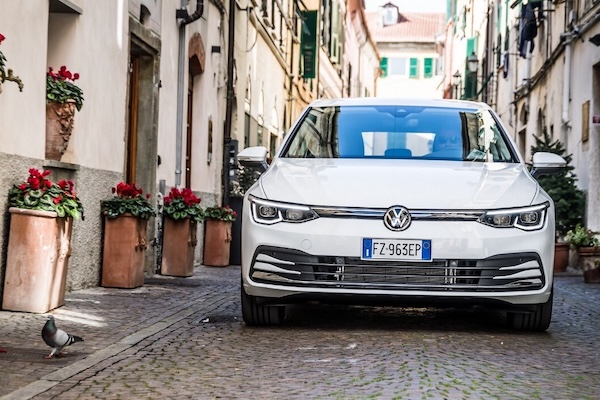 The VW Golf is #3 in Europe in September.
In the models charts, Tesla manages a historic 1-2 for the second time after December 2022, placing the Model Y (+55.3%) at #1 and the Model 3 (+105.7%) at #2. The Model Y crosses the 40,000 monthly unit mark for the 2nd time after March 2023 (46,061), ranking #1 in Germany (20% of its September volume), France (also 20%), Iceland, Ireland, Sweden, the Netherlands, Norway, Switzerland, Denmark, Finland and potentially in Belgium and Luxembourg! An additional 15% of its September tally comes from the UK where it ranks #5. This way, the Model Y snaps the YTD top spot thanks to sales up 51.8%. It ranked #15 over the Full Year 2025. For its part the Model 3 hits its highest ranking since December 2022, with 40% of its monthly total coming from the UK.
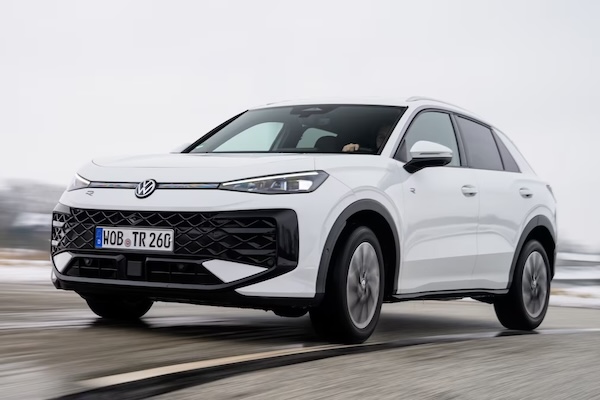
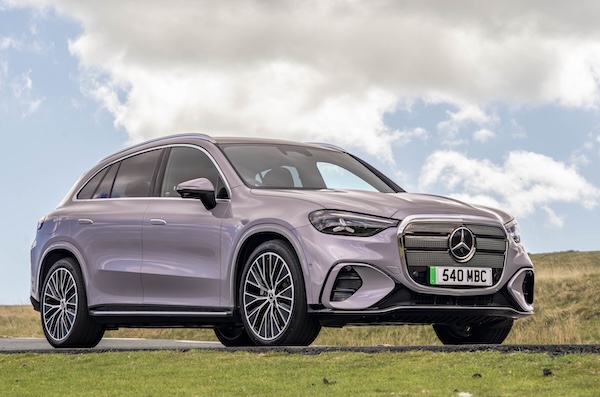
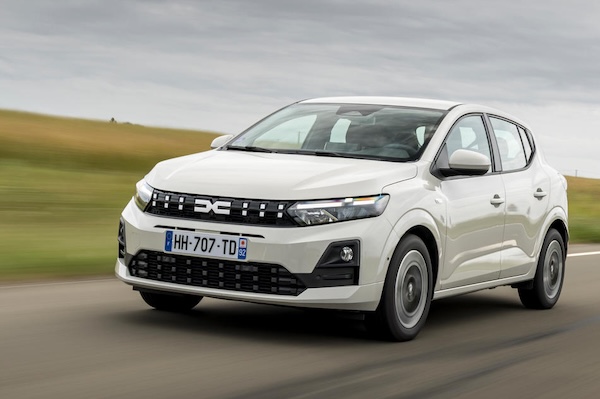
The VW Golf (-0.8%) is the best of the rest at #3, distancing the Dacia Sandero (-8.6%) in a rut and down to #2 year-to-date. The VW Tiguan (-7.2%) also disappoints but still manages a 5th place for the 2nd month running vs. #8 so far this year. At #6, the Mercedes GLC (+57.5%) confirms its new generation is a continent-wide hit, especially as Germany only account for 31% of its September result. The Toyota Yaris Cross (+0.1%) is back up to #7 ahead of a freefalling Renault Clio (-21.8%) and the Peugeot 208 (+3.6%). The Jaecoo 7 (+65.9%) cracks the Top 10 for the first time at #10 thanks to an exceptional UK performance (#1) which represents 70% of its September tally. It is the first Chinese model to rank inside the European Top 10. The best-selling new model is the Renault Twingo E-Tech at #50.
Previous month: Europe August 2026: Chinese pull market up 5.3%, BEVs at 29.2% share, VW T-Roc #1, Mercedes GLC up to record #4
One year ago: Europe September 2025: Tesla Model Y back to #1, Chinese at 7.4% share
Full September 2026 Top 15 OEMs, Top 85 All brands and Top 640 All models below.
Europe September 2026 – OEMs:
| Pos | OEM | Sep-26 | /25 | Aug | 1-9 2026 | /25 | Pos | FY25 |
| 1 | Volkswagen Group | 304,382 | – 2.8% | 1 | 2,657,706 | + 0.5% | 1 | 1 |
| 2 | Stellantis | 171,819 | + 5.1% | 2 | 1,546,958 | + 4.2% | 2 | 2 |
| 3 | Renault Group | 112,432 | – 0.8% | 3 | 972,500 | – 3.2% | 3 | 3 |
| 4 | Hyundai-Kia | 93,959 | – 2.7% | 4 | 761,015 | – 5.5% | 4 | 4 |
| 5 | Toyota Group | 86,811 | + 1.1% | 6 | 708,112 | + 0.5% | 6 | 6 |
| 6 | BMW Group | 84,297 | – 0.0% | 5 | 741,898 | + 3.5% | 5 | 5 |
| 7 | Mercedes | 66,988 | + 4.0% | 7 | 537,619 | + 1.8% | 7 | 7 |
| 8 | Tesla | 66,035 | + 71.1% | 13 | 256,924 | + 47.8% | 13 | 12 |
| 9 | Chery Group | 56,552 | + 187.3% | 11 | 283,075 | + 252.9% | 10 | n/a |
| 10 | Geely Group | 51,493 | + 31.3% | 10 | 326,679 | + 12.4% | 8 | 9 |
| 11 | BYD Auto | 49,374 | + 102.4% | 9 | 281,984 | + 135.2% | 11 | 13 |
| 12 | SAIC Motor | 41,707 | + 24.4% | 12 | 271,327 | + 20.3% | 12 | 11 |
| 13 | Ford Motor | 36,579 | – 18.3% | 8 | 325,996 | – 14.2% | 9 | 8 |
| 14 | Nissan-Mitsubishi | 27,288 | – 12.5% | 14 | 228,406 | – 13.4% | 14 | 10 |
| 15 | Mazda | 19,478 | + 23.5% | 15 | 131,288 | + 13.7% | 16 | n/a |
| 16 | Suzuki | 16,577 | + 2.9% | 16 | 133,149 | – 0.1% | 15 | n/a |
| 17 | Leapmotor | 14,382 | + 324.2% | n/a | 87,214 | + 429.0% | 17 | n/a |
| 18 | Jaguar Land Rover | 12,475 | + 35.1% | n/a | 83,974 | – 3.7% | 18 | n/a |
Europe September 2026 – brands:
| Pos | Brand | Sep-26 | /25 | Aug | 1-9 2026 | /25 | Pos | FY25 |
| 1 | Volkswagen | 118,816 | – 4.8% | 1 | 1,043,587 | – 3.4% | 1 | 1 |
| 2 | Toyota | 78,319 | + 0.2% | 2 | 653,068 | + 1.0% | 3 | 2 |
| 3 | Skoda | 76,891 | + 0.5% | 3 | 665,599 | + 7.6% | 2 | 3 |
| 4 | Mercedes | 66,988 | + 4.0% | 5 | 537,619 | + 1.8% | 6 | 6 |
| 5 | Renault | 66,880 | + 4.6% | 6 | 556,648 | + 1.3% | 5 | 5 |
| 6 | BMW | 66,520 | – 1.3% | 4 | 600,679 | + 1.3% | 4 | 4 |
| 7 | Tesla | 66,035 | + 71.1% | 19 | 256,924 | + 47.8% | 18 | 20 |
| 8 | Audi | 58,402 | – 3.4% | 8 | 501,088 | + 3.3% | 7 | 7 |
| 9 | Kia | 54,433 | + 11.6% | 7 | 411,632 | + 2.1% | 9 | 11 |
| 10 | Peugeot | 54,240 | + 1.4% | 9 | 483,616 | – 4.1% | 8 | 8 |
| 11 | BYD | 49,340 | + 102.3% | 13 | 281,902 | + 135.2% | 15 | 22 |
| 12 | Dacia | 44,129 | – 8.8% | 10 | 404,099 | – 9.8% | 10 | 9 |
| 13 | MG | 41,699 | + 24.4% | 16 | 271,194 | + 20.4% | 17 | 16 |
| 14 | Hyundai | 39,307 | – 17.5% | 12 | 347,607 | – 13.2% | 11 | 10 |
| 15 | Opel/Vauxhall | 38,071 | – 0.9% | 14 | 322,493 | + 5.6% | 13 | 13 |
| 16 | Ford | 36,579 | – 18.3% | 11 | 325,996 | – 14.2% | 12 | 12 |
| 17 | Citroën | 34,247 | + 21.2% | 15 | 302,792 | + 12.1% | 14 | 14 |
| 18 | Volvo | 32,456 | + 2.6% | 20 | 239,113 | – 1.6% | 19 | 15 |
| 19 | Fiat | 28,515 | + 23.7% | 18 | 275,700 | + 26.5% | 16 | 19 |
| 20 | Cupra | 27,072 | + 7.4% | 17 | 223,914 | + 1.0% | 20 | 17 |
| 21 | Nissan | 24,828 | – 13.7% | 21 | 205,364 | – 9.9% | 21 | 18 |
| 22 | Jaecoo | 24,321 | + 156.6% | 24 | 112,722 | + 212.3% | 26 | 32 |
| 23 | Mazda | 19,478 | + 23.5% | 23 | 131,288 | + 13.7% | 25 | 25 |
| 24 | Mini | 17,715 | + 5.2% | 25 | 140,575 | + 14.5% | 23 | 24 |
| 25 | Suzuki | 16,577 | + 2.9% | 26 | 133,149 | – 0.1% | 24 | 23 |
| 26 | Seat | 15,587 | – 13.3% | 22 | 155,777 | – 4.7% | 22 | 21 |
| 27 | Omoda | 15,415 | + 110.6% | 27 | 92,913 | + 165.2% | 28 | 33 |
| 28 | Leapmotor | 14,382 | + 324.2% | 28 | 87,214 | + 429.0% | 29 | 36 |
| 29 | Chery | 13,338 | + 688.8% | 32 | 53,924 | + 2547.2% | 34 | 47 |
| 30 | Land Rover | 12,474 | + 35.3% | 30 | 83,937 | – 0.6% | 30 | 27 |
| 31 | Jeep | 10,655 | – 3.8% | 29 | 95,617 | – 6.7% | 27 | 26 |
| 32 | Geely | 10,500 | + 3610.2% | 36 | 31,344 | + 1642.3% | 38 | 55 |
| 33 | Honda | 8,921 | + 0.1% | 33 | 58,344 | + 4.3% | 32 | 30 |
| 34 | Lexus | 8,492 | + 10.5% | 35 | 55,043 | – 5.7% | 33 | 29 |
| 35 | Porsche | 7,055 | – 7.4% | 34 | 62,715 | – 10.7% | 31 | 28 |
| 36 | Polestar | 5,104 | – 12.7% | 38 | 33,645 | – 1.9% | 37 | 34 |
| 37 | Xpeng | 5,008 | + 229.5% | 31 | 34,218 | + 172.3% | 36 | 39 |
| 38 | Alfa Romeo | 3,118 | – 45.5% | 37 | 35,045 | – 25.3% | 35 | 31 |
| 39 | Smart | 2,481 | + 98.6% | 43 | 15,406 | + 71.3% | 44 | 42 |
| 40 | Mitsubishi | 2,460 | + 1.6% | 39 | 23,041 | – 36.0% | 39 | 35 |
| 41 | Subaru | 2,130 | + 43.3% | 40 | 16,709 | + 4.2% | 42 | 40 |
| 42 | Ebro | 2,125 | + 78.4% | 41 | 20,256 | + 188.0% | 40 | 43 |
| 43 | Zeekr | 2,025 | + 296.3% | 42 | 10,487 | + 243.4% | 48 | 52 |
| 44 | DR | 1,522 | + 1.9% | 47 | 11,924 | – 8.7% | 45 | 41 |
| 45 | DS | 1,520 | – 31.7% | 44 | 18,563 | – 19.3% | 41 | 37 |
| 46 | KGM | 1,464 | – 22.8% | 45 | 16,629 | – 9.0% | 43 | 38 |
| 47 | Alpine | 1,422 | + 45.7% | 48 | 11,745 | + 64.7% | 46 | 45 |
| 48 | Lynk & Co | 1,150 | + 68.9% | 46 | 10,521 | + 59.1% | 47 | 48 |
| 49 | Lepas | 1,069 | new | n/a | 1,110 | new | 67 | – |
| 50 | Lancia | 890 | + 7.2% | 50 | 9,011 | + 3.3% | 49 | 44 |
| 51 | Dongfeng | 660 | + 156.8% | 52 | 5,233 | + 190.6% | 53 | 63 |
| 52 | DFSK | 556 | – 30.8% | 49 | 5,619 | – 29.9% | 52 | 46 |
| 53 | GWM | 544 | + 86.3% | 53 | 2,335 | – 25.2% | 56 | 56 |
| 54 | Beijing/BAIC | 465 | – 14.5% | 51 | 6,164 | + 28.9% | 51 | 50 |
| 55 | EVO | 407 | – 50.2% | 57 | 6,187 | + 8.4% | 50 | 49 |
| 56 | Ferrari | 390 | + 3.4% | 54 | 4,149 | – 1.2% | 54 | 51 |
| 57 | Lamborghini | 324 | + 15.7% | 56 | 3,026 | – 4.6% | 55 | 54 |
| 58 | Jetour | 284 | n/a | 55 | 2,150 | + 30614.3% | 58 | 97 |
| 59 | Abarth | 270 | + 53.4% | 58 | 1,494 | – 14.4% | 65 | 64 |
| 60 | Aston Martin | 261 | + 4.8% | 59 | 2,005 | + 6.5% | 59 | 61 |
| 61 | Lotus | 258 | – 5.5% | 63 | 1,569 | – 19.2% | 63 | 59 |
| 62 | Maserati | 241 | – 5.1% | 61 | 2,224 | – 25.4% | 57 | 53 |
| 63 | Bentley | 235 | – 9.6% | 60 | 1,977 | – 9.7% | 60 | 58 |
| 64 | Genesis | 219 | + 75.2% | 65 | 1,776 | – 13.5% | 62 | 60 |
| 65 | NIO | 184 | + 15.0% | 64 | 759 | – 1.9% | 70 | 68 |
| 66 | JAC | 182 | + 323.3% | 62 | 1,523 | + 377.4% | 64 | 77 |
| 67 | Stilnovo | 148 | new | 67 | 618 | new | 74 | – |
| 68 | Hongqi | 133 | + 43.0% | 66 | 837 | + 22.4% | 68 | 72 |
| 69 | ICH-X | 121 | + 28.7% | 70 | 1,237 | + 413.3% | 66 | 81 |
| 70 | Voyah | 98 | + 100.0% | 68 | 654 | + 19.1% | 72 | 76 |
| 71 | Ineos | 94 | + 74.1% | 75 | 678 | – 36.0% | 71 | 70 |
| 72 | Chevrolet | 86 | + 10.3% | 74 | 582 | – 52.4% | 75 | 69 |
| 73 | Sportequipe | 80 | – 50.3% | 71 | 1,805 | + 19.3% | 61 | 65 |
| 74 | Rolls-Royce | 62 | – 13.9% | 73 | 644 | – 13.3% | 73 | 74 |
| 75 | Cadillac | 59 | + 20.4% | 69 | 417 | – 28.1% | 76 | 79 |
| 76 | Tiger | 48 | + 17.1% | 76 | 778 | + 47.1% | 69 | 73 |
| 77 | McLaren | 43 | + 65.4% | 77 | 275 | – 32.1% | 78 | 85 |
| 78 | Dodge | 41 | – 41.4% | 72 | 344 | – 54.2% | 77 | 75 |
| 79 | Denza | 34 | + 1600.0% | 78 | 82 | + 645.5% | 80 | 100 |
| 80 | Chrysler | 10 | + 150.0% | 80 | 54 | + 8.0% | 81 | 95 |
| 81 | Maxus | 8 | – 55.6% | 79 | 133 | – 67.2% | 79 | 84 |
| 82 | Lada | 2 | – 84.6% | 81 | 37 | – 26.0% | 83 | 96 |
| 83 | Jaguar | 1 | – 93.3% | – | 37 | – 98.7% | 82 | 57 |
| 84 | Mobilize | 1 | n/a | – | 8 | n/a | 85 | – |
| 85 | Ram | 1 | + 0.0% | 82 | 5 | + 0.0% | 86 | 114 |
Europe September 2026 – models:
| Pos | Model | Sep-26 | /25 | Aug | 1-9 2026 | /25 | Pos | FY25 |
| 1 | Tesla Model Y | 40,971 | + 55.3% | 7 | 167,369 | + 51.8% | 1 | 15 |
| 2 | Tesla Model 3 | 25,057 | + 105.7% | 34 | 88,618 | + 41.1% | 27 | 43 |
| 3 | VW Golf | 18,088 | – 0.8% | 3 | 151,334 | + 2.5% | 3 | 5 |
| 4 | Dacia Sandero | 17,547 | – 8.6% | 2 | 162,969 | – 10.9% | 2 | 1 |
| 5 | VW Tiguan | 16,457 | – 7.2% | 5 | 137,839 | – 7.7% | 8 | 4 |
| 6 | Mercedes GLC | 16,317 | + 57.5% | 4 | 106,648 | + 32.9% | 18 | 28 |
| 7 | Toyota Yaris Cross | 16,036 | + 0.1% | 10 | 138,337 | – 1.9% | 7 | 6 |
| 8 | Renault Clio | 15,735 | – 21.8% | 11 | 144,677 | – 15.0% | 5 | 2 |
| 9 | Peugeot 208 | 15,733 | + 3.6% | 9 | 138,665 | – 4.4% | 6 | 7 |
| 10 | Jaecoo 7 | 15,470 | + 65.9% | 48 | 68,856 | + 91.6% | 43 | 90 |
| 11 | Opel/Vauxhall Corsa | 15,337 | – 1.3% | 19 | 123,674 | – 6.3% | 10 | 11 |
| 12 | Kia Sportage | 14,935 | – 11.2% | 18 | 117,383 | + 0.8% | 14 | 17 |
| 13 | VW T-Roc | 14,908 | – 19.2% | 1 | 147,763 | – 7.9% | 4 | 3 |
| 14 | Ford Puma | 14,786 | – 11.9% | 15 | 112,659 | – 2.7% | 16 | 14 |
| 15 | Citroen C3 | 14,201 | + 34.2% | 6 | 118,677 | – 4.9% | 12 | 12 |
| 16 | VW Polo | 14,150 | + 10.5% | 25 | 85,793 | + 6.0% | 29 | 31 |
| 17 | Toyota Yaris | 14,034 | – 4.4% | 8 | 117,674 | – 5.4% | 13 | 10 |
| 18 | BYD Seal U | 13,466 | + 17.0% | 21 | 79,408 | + 43.3% | 35 | 48 |
| 19 | Audi A3 | 13,279 | + 15.2% | 20 | 87,064 | – 3.0% | 28 | 21 |
| 20 | Peugeot 2008 | 13,060 | – 4.0% | 17 | 123,768 | – 7.1% | 9 | 8 |
| 21 | Nissan Qashqai | 12,891 | – 14.1% | 49 | 110,282 | + 0.9% | 17 | 18 |
| 22 | Peugeot 3008 | 12,707 | + 18.4% | 29 | 92,310 | – 2.2% | 23 | 22 |
| 23 | Hyundai Tucson | 12,194 | – 8.8% | 16 | 114,485 | + 1.3% | 15 | 16 |
| 24 | Skoda Elroq | 12,129 | + 18.5% | 12 | 89,268 | + 50.7% | 26 | 38 |
| 25 | Dacia Duster | 11,981 | – 8.1% | 13 | 106,420 | – 22.3% | 19 | 9 |
| 26 | Fiat Panda | 11,404 | + 35.6% | 39 | 99,244 | + 6.5% | 20 | 24 |
| 27 | MG ZS | 11,205 | + 2.1% | 26 | 92,496 | – 2.5% | 22 | 20 |
| 28 | Mercedes CLA | 11,196 | + 55.0% | 23 | 80,816 | + 110.4% | 33 | 78 |
| 29 | Skoda Octavia | 10,942 | – 18.8% | 14 | 118,751 | – 1.4% | 11 | 13 |
| 30 | Renault Captur | 10,827 | – 8.8% | 47 | 92,713 | – 11.1% | 21 | 19 |
| 31 | BYD Atto 2 | 10,501 | + 878.7% | 43 | 64,265 | + 1254.4% | 48 | 244 |
| 32 | Mini Cooper | 9,676 | + 8.6% | 32 | 77,785 | + 10.4% | 37 | 37 |
| 33 | MG HS | 9,650 | + 0.4% | 63 | 63,184 | + 15.5% | 49 | 51 |
| 34 | Skoda Kodiaq | 9,622 | + 2.5% | 27 | 91,380 | + 12.9% | 24 | 29 |
| 35 | BMW X1 | 9,518 | + 43.3% | 24 | 90,883 | + 4.4% | 25 | 23 |
| 36 | Toyota Corolla | 9,142 | – 10.7% | 22 | 83,854 | – 5.1% | 30 | 26 |
| 37 | Skoda Fabia | 9,118 | – 10.8% | 35 | 79,040 | – 3.9% | 36 | 30 |
| 38 | Renault 5 | 9,048 | + 42.0% | 46 | 68,937 | + 37.1% | 42 | 45 |
| 39 | Hyundai Kona | 9,030 | – 0.3% | 36 | 74,495 | – 0.9% | 40 | 33 |
| 40 | Citroen C3 Aircross | 8,901 | + 31.3% | 37 | 77,427 | + 153.6% | 38 | 94 |
| 41 | Toyota C-HR | 8,803 | – 22.9% | 30 | 81,011 | – 8.3% | 32 | 25 |
| 42 | Skoda Enyaq | 8,411 | + 52.5% | 41 | 61,306 | + 28.9% | 53 | 70 |
| 43 | Omoda 5 | 8,396 | + 65.5% | 56 | 58,622 | + 98.0% | 57 | 114 |
| 44 | Skoda Kamiq | 8,219 | – 11.1% | 40 | 76,580 | – 2.8% | 39 | 32 |
| 45 | Skoda Karoq | 8,173 | – 3.1% | 44 | 67,672 | – 1.2% | 44 | 41 |
| 46 | VW T-Cross | 8,082 | + 16.4% | 53 | 81,738 | – 4.8% | 31 | 27 |
| 47 | Opel/Vauxhall Frontera | 8,042 | + 39.2% | 45 | 64,939 | + 170.9% | 47 | 112 |
| 48 | Seat Ibiza | 7,906 | + 14.0% | 50 | 64,980 | + 10.5% | 46 | 50 |
| 49 | Ford Kuga | 7,736 | – 8.3% | 42 | 70,350 | – 7.5% | 41 | 35 |
| 50 | Renault Twingo E-Tech | 7,636 | new | 73 | 25,423 | new | 133 | – |
| 51 | VW ID.4 | 7,630 | + 23.9% | 33 | 60,093 | + 4.0% | 55 | 47 |
| 52 | Volvo XC40 | 7,521 | – 11.6% | 106 | 55,212 | – 8.5% | 62 | 46 |
| 53 | BMW X3 | 7,471 | – 14.7% | 51 | 62,893 | + 19.3% | 51 | 55 |
| 54 | Toyota Aygo X | 7,441 | – 35.0% | 38 | 80,145 | + 10.9% | 34 | 34 |
| 55 | Mercedes GLA | 7,239 | – 10.1% | 65 | 52,860 | – 4.2% | 66 | 57 |
| 56 | BMW ix3 | 7,228 | + 7429.2% | 31 | 43,304 | + 837.7% | 84 | 276 |
| 57 | Jeep Avenger | 7,226 | – 21.6% | 70 | 67,606 | – 11.0% | 45 | 36 |
| 58 | Volvo EX30 | 7,169 | + 44.8% | 75 | 40,896 | + 22.3% | 90 | 98 |
| 59 | Cupra Formentor | 7,100 | + 18.9% | 52 | 60,882 | – 5.5% | 54 | 44 |
| 60 | Jaecoo 5 | 7,075 | + 4494.2% | 64 | 37,761 | + 23649.1% | 100 | 298 |
| 61 | Kia EV3 | 7,017 | + 20.5% | 55 | 43,441 | – 15.1% | 82 | 68 |
| 62 | Kia EV2 | 6,808 | n/a | 54 | 23,276 | + 2327500.0% | 140 | 699 |
| 63 | Geely Starray | 6,743 | + 11941.1% | 122 | 21,136 | + 5093.1% | 152 | 438 |
| 64 | Mercedes GLB | 6,618 | + 233.2% | 60 | 37,692 | + 108.4% | 101 | 160 |
| 65 | Suzuki Swift | 6,531 | – 13.2% | 83 | 55,053 | – 0.3% | 63 | 58 |
| 66 | MG3 | 6,507 | – 10.8% | 87 | 55,343 | + 22.0% | 61 | 77 |
| 67 | Toyota RAV4 | 6,417 | – 20.5% | 59 | 31,651 | – 42.7% | 114 | 53 |
| 68 | Audi A5 | 6,290 | – 1.5% | 80 | 52,055 | + 12.2% | 68 | 67 |
| 69 | Renault Symbioz | 6,256 | + 10.9% | 84 | 57,471 | + 5.0% | 58 | 61 |
| 70 | BMW 1 Series | 6,253 | – 37.9% | 99 | 62,690 | – 9.2% | 52 | 39 |
| 71 | Volvo XC60 | 6,249 | – 24.6% | 76 | 59,101 | – 9.4% | 56 | 42 |
| 72 | BMW ix1 | 6,140 | + 39.7% | 28 | 55,036 | + 15.4% | 64 | 62 |
| 73 | Fiat Grande Panda | 6,071 | + 33.6% | 66 | 57,132 | + 340.0% | 59 | 153 |
| 74 | Hyundai i20 | 6,065 | + 11.0% | 81 | 51,271 | – 3.4% | 69 | 64 |
| 75 | Leapmotor B10 | 5,939 | + 1879.7% | 93 | 25,723 | + 7291.7% | 131 | 312 |
| 76 | BMW 3 Series | 5,917 | – 3.9% | 61 | 49,723 | – 9.4% | 72 | 60 |
| 77 | Peugeot 5008 | 5,807 | + 17.2% | 72 | 53,410 | + 22.8% | 65 | 85 |
| 78 | Dacia Bigster | 5,770 | – 18.4% | 57 | 63,111 | + 61.1% | 50 | 69 |
| 79 | VW ID.7 | 5,687 | – 9.0% | 58 | 46,614 | – 13.4% | 74 | 52 |
| 80 | Toyota C-HR+ | 5,645 | + 112800.0% | 104 | 27,415 | + 548200.0% | 126 | – |
| 81 | VW Tayron | 5,642 | + 1.7% | 69 | 49,850 | + 40.2% | 71 | 93 |
| 82 | Citroen C5 Aircross | 5,633 | + 40.2% | 108 | 44,781 | + 30.8% | 78 | 107 |
| 83 | Mini Countryman | 5,626 | + 13.1% | 140 | 44,902 | + 26.1% | 77 | 97 |
| 84 | VW ID.3 | 5,593 | – 27.5% | 68 | 55,989 | – 2.2% | 60 | 49 |
| 85 | Nissan Juke | 5,564 | – 34.8% | 117 | 50,034 | – 29.2% | 70 | 40 |
| 86 | Kia Picanto | 5,396 | – 15.5% | 89 | 46,331 | – 10.2% | 75 | 71 |
| 87 | Opel/Vauxhall Mokka | 5,073 | – 30.2% | 74 | 52,232 | – 12.5% | 67 | 54 |
| 88 | BYD Sealion 07 | 5,048 | + 47.3% | 139 | 26,267 | + 77.7% | 129 | 163 |
| 89 | Fiat 500 | 4,909 | + 198.8% | 95 | 38,051 | + 136.8% | 97 | 161 |
| 90 | Cupra Terramar | 4,888 | – 16.4% | 78 | 43,919 | – 1.0% | 81 | 81 |
| 91 | Volvo EX40 | 4,877 | + 53.1% | 110 | 31,730 | + 43.1% | 113 | 124 |
| 92 | Cupra Raval | 4,811 | + 96120.0% | 71 | 14,729 | + 43220.6% | 186 | 569 |
| 93 | Dacia Jogger | 4,739 | + 2.7% | 91 | 40,646 | – 22.5% | 91 | 66 |
| 94 | Suzuki Vitara | 4,734 | – 6.0% | 94 | 41,793 | – 1.8% | 89 | 84 |
| 95 | Chery Tiggo 8 | 4,677 | + 521.9% | 144 | 20,609 | + 2231.3% | 155 | 300 |
| 96 | Cupra Leon | 4,674 | – 1.3% | 67 | 46,208 | – 3.8% | 76 | 74 |
| 97 | Mercedes A Class | 4,668 | – 39.3% | 85 | 42,494 | – 19.3% | 86 | 63 |
| 98 | Renault Austral | 4,656 | – 15.7% | 118 | 42,481 | – 11.0% | 87 | 72 |
| 99 | Mercedes C Class | 4,642 | + 39.7% | 98 | 34,564 | – 7.8% | 106 | 99 |
| 100 | Kia Stonic | 4,616 | – 11.1% | 100 | 42,125 | – 1.1% | 88 | 87 |
| 101 | Chery Tiggo 7 | 4,614 | + 396.7% | 173 | 16,822 | + 1379.5% | 174 | 289 |
| 102 | VW Passat | 4,553 | – 24.7% | 79 | 44,161 | – 18.8% | 80 | 59 |
| 103 | Audi Q4 | 4,516 | + 18.3% | 125 | 29,756 | – 4.8% | 120 | 108 |
| 104 | Mazda CX-30 | 4,447 | – 19.6% | 120 | 39,341 | + 15.0% | 93 | 102 |
| 105 | Mazda CX-5 | 4,379 | + 237.1% | 132 | 22,532 | + 49.7% | 143 | 192 |
| 106 | BYD Seal | 4,342 | + 74.1% | 163 | 20,693 | + 44.4% | 153 | 175 |
| 107 | Opel/Vauxhall Grandland | 4,330 | – 15.7% | 105 | 37,221 | + 0.6% | 102 | 96 |
| 108 | Seat Arona | 4,258 | – 19.9% | 82 | 44,756 | – 8.6% | 79 | 75 |
| 109 | MG4 Urban | 4,225 | new | 136 | 13,405 | new | 197 | – |
| 110 | Audi Q3 | 4,091 | + 39.4% | 109 | 38,796 | + 47.5% | 95 | 120 |
| 111 | Audi Q5 | 4,060 | – 16.0% | 111 | 32,382 | + 19.7% | 111 | 118 |
| 112 | Omoda 7 | 4,053 | n/a | 175 | 14,958 | + 299060.0% | 182 | 733 |
| 113 | BMW X5 | 4,001 | – 17.7% | 103 | 32,035 | + 0.6% | 112 | 110 |
| 114 | VW Taigo | 3,989 | – 7.8% | 90 | 48,360 | – 15.8% | 73 | 56 |
| 115 | Ford Transit Custom | 3,987 | + 6.6% | 62 | 38,192 | – 12.3% | 96 | 91 |
| 116 | Peugeot 308 | 3,983 | – 31.5% | 121 | 43,413 | – 17.4% | 83 | 73 |
| 117 | Audi Q6 | 3,945 | – 0.0% | 97 | 30,636 | – 14.4% | 117 | 100 |
| 118 | Renault Scenic E-Tech | 3,860 | – 1.2% | 101 | 34,288 | + 29.8% | 107 | 119 |
| 119 | Toyota bZ4X | 3,843 | + 133.9% | 86 | 31,541 | + 32.7% | 115 | 139 |
| 120 | Hyundai Inster | 3,841 | – 1.0% | 112 | 29,427 | + 18.6% | 121 | 131 |
| 121 | Ford Explorer | 3,814 | – 13.7% | 77 | 33,178 | + 5.7% | 110 | 105 |
| 122 | Kia EV5 | 3,786 | + 378500.0% | 119 | 22,024 | + 734033.3% | 147 | 389 |
| 123 | Skoda Superb | 3,753 | – 18.6% | 102 | 38,046 | – 2.9% | 98 | 92 |
| 124 | VW Transporter | 3,695 | – 18.4% | 96 | 43,264 | + 0.6% | 85 | 80 |
| 125 | Opel/Vauxhall Astra | 3,650 | – 9.0% | 124 | 30,403 | – 27.1% | 118 | 88 |
| 126 | Range Rover Sport | 3,645 | + 56.3% | 167 | 21,454 | + 4.7% | 150 | 146 |
| 127 | Mercedes E Class | 3,631 | + 10.1% | 92 | 35,469 | + 1.9% | 104 | 103 |
| 128 | BYD Sealion 05 | 3,613 | new | 133 | 15,313 | new | 179 | – |
| 129 | Audi Q3 Sportback | 3,549 | + 31.8% | 115 | 33,464 | + 17.0% | 109 | 123 |
| 130 | Land Rover Defender | 3,513 | + 106.0% | 179 | 23,270 | + 23.0% | 141 | 155 |
| 131 | Skoda Scala | 3,404 | – 18.2% | 116 | 30,345 | – 7.1% | 119 | 113 |
| 132 | Lexus LBX | 3,335 | + 22.7% | 168 | 19,679 | – 4.5% | 159 | 143 |
| 133 | Jeep Compass | 3,319 | + 282.4% | 137 | 24,405 | + 72.4% | 135 | 191 |
| 134 | Volvo XC90 | 3,195 | + 7.2% | 181 | 23,631 | – 7.8% | 139 | 130 |
| 135 | BYD Dolphin Surf | 3,192 | + 25.5% | 154 | 25,938 | + 223.7% | 130 | 169 |
| 136 | BYD Atto 3 | 3,185 | + 86.6% | 148 | 15,570 | + 46.8% | 178 | 203 |
| 137 | Leapmotor T03 | 3,133 | + 46.5% | 145 | 40,361 | + 264.9% | 92 | 173 |
| 138 | Audi A6 | 3,097 | + 11.6% | 131 | 28,119 | – 7.0% | 124 | 117 |
| 139 | Audi A1 | 3,060 | – 51.1% | 169 | 39,272 | – 12.4% | 94 | 79 |
| 140 | BMW 2 Series | 3,014 | – 15.5% | 157 | 23,128 | + 4.8% | 142 | 138 |
| 141 | Fiat 600 | 2,976 | – 30.2% | 135 | 33,828 | – 26.2% | 108 | 83 |
| 142 | Cupra Born | 2,972 | – 30.5% | 147 | 28,856 | – 11.7% | 122 | 109 |
| 143 | Omoda 9 | 2,965 | + 31.9% | 156 | 19,329 | + 257.3% | 162 | 223 |
| 144 | Kia EV4 | 2,926 | + 293.8% | 134 | 21,444 | + 2744.0% | 151 | 293 |
| 145 | Dacia Spring | 2,891 | + 8.7% | 123 | 24,512 | – 4.6% | 134 | 129 |
| 146 | Suzuki SX4 S-Cross | 2,890 | – 7.8% | 142 | 24,232 | – 8.5% | 138 | 128 |
| 147 | BMW 5 Series | 2,862 | – 21.1% | 88 | 35,279 | – 15.7% | 105 | 82 |
| 148 | Honda HR-V | 2,851 | + 30.4% | 176 | 18,818 | + 29.3% | 164 | 176 |
| 149 | Mercedes GLE | 2,849 | – 17.6% | 150 | 24,298 | – 8.5% | 137 | 121 |
| 150 | Xpeng G6 | 2,847 | + 147.1% | 107 | 21,902 | + 153.3% | 148 | 201 |
| 151 | VW ID.Buzz | 2,840 | + 29.7% | 158 | 19,738 | + 6.1% | 158 | 144 |
| 152 | Renault 4 | 2,835 | + 63.7% | 141 | 22,152 | + 312.4% | 144 | 206 |
| 153 | Leapmotor C10 | 2,827 | + 197.6% | 149 | 16,656 | + 229.8% | 175 | 226 |
| 154 | MG S9 | 2,805 | new | 206 | 7,391 | new | 246 | – |
| 155 | Chery Tiggo 5X | 2,763 | + 30600.0% | 230 | 9,766 | + 108411.1% | 223 | 377 |
| 156 | Porsche Cayenne | 2,760 | + 50.3% | 159 | 19,342 | + 16.6% | 161 | 166 |
| 157 | BYD Dolphin G | 2,746 | new | 197 | 5,923 | new | 267 | – |
| 158 | VW Caddy | 2,660 | – 14.2% | 127 | 28,607 | – 8.6% | 123 | 116 |
| 159 | Audi A6 e-tron | 2,588 | + 7.2% | 114 | 25,433 | + 27.3% | 132 | 135 |
| 160 | Citroen C4 | 2,586 | – 39.1% | 152 | 26,861 | – 39.0% | 128 | 89 |
| 161 | VW ID.Polo | 2,496 | new | 143 | 4,684 | new | 281 | – |
| 162 | Nissan Micra | 2,489 | + 124350.0% | 166 | 14,028 | + 46660.0% | 192 | 417 |
| 163 | Seat Leon | 2,477 | – 28.7% | 129 | 31,014 | – 14.7% | 116 | 95 |
| 164 | Porsche Macan | 2,468 | – 12.9% | 198 | 17,793 | – 21.6% | 171 | 137 |
| 165 | MG S5 | 2,458 | + 8.3% | 160 | 14,924 | + 141.8% | 183 | 210 |
| 166 | BMW i4 | 2,423 | – 35.9% | 130 | 26,901 | – 19.2% | 127 | 106 |
| 167 | Polestar 2 | 2,420 | + 6.2% | 221 | 11,035 | – 14.6% | 212 | 193 |
| 168 | Mini Aceman | 2,409 | – 18.3% | 155 | 17,875 | + 7.1% | 169 | 148 |
| 169 | Toyota Corolla Cross | 2,340 | + 5.8% | 126 | 24,329 | + 4.7% | 136 | 136 |
| 170 | Geely EX5 | 2,282 | + 25255.6% | 252 | 6,580 | + 10181.3% | 255 | 373 |
| 171 | Lexus NX | 2,272 | + 2.6% | 171 | 17,294 | – 4.9% | 173 | 158 |
| 172 | Honda Jazz | 2,263 | – 27.7% | 195 | 13,911 | – 19.6% | 193 | 172 |
| 173 | Polestar 4 | 2,245 | – 27.2% | 200 | 20,004 | + 15.7% | 156 | 162 |
| 174 | Alfa Romeo Junior | 2,238 | – 32.7% | 162 | 22,075 | – 16.4% | 145 | 125 |
| 175 | Mazda3 | 2,210 | – 1.1% | 178 | 17,835 | + 3.7% | 170 | 159 |
| 176 | Suzuki e Vitara | 2,205 | + 3292.3% | 210 | 9,918 | + 15158.5% | 222 | 340 |
| 177 | Audi Q5 Sportback | 2,203 | – 25.5% | 174 | 19,916 | + 43.3% | 157 | 171 |
| 178 | Mazda CX-6e | 2,161 | new | 204 | 3,263 | new | 306 | – |
| 179 | BMW 4 Series | 2,090 | + 11.9% | 146 | 18,813 | – 6.0% | 165 | 150 |
| 180 | Hyundai Ioniq 5 | 2,075 | – 9.7% | 177 | 14,814 | – 20.5% | 184 | 154 |
| 181 | BMW X2 | 2,058 | – 3.5% | 164 | 22,047 | – 9.4% | 146 | 134 |
| 182 | Fiat Ducato | 2,055 | – 28.0% | 113 | 37,872 | – 3.4% | 99 | 104 |
| 183 | Kia Niro | 1,941 | – 54.4% | 138 | 27,535 | – 27.7% | 125 | 101 |
| 184 | BYD Seal 06 | 1,933 | + 270.3% | 172 | 19,346 | + 2380.3% | 160 | 272 |
| 185 | Mazda 6e | 1,820 | + 132.1% | 187 | 12,035 | + 781.0% | 204 | 251 |
| 186 | Audi Q4 Sportback | 1,787 | + 24.6% | 232 | 10,984 | – 18.3% | 214 | 179 |
| 187 | Jaecoo 8 | 1,776 | n/a | 207 | 6,105 | + 203400.0% | 265 | 771 |
| 188 | MG S6 | 1,763 | new | 224 | 7,493 | new | 245 | 475 |
| 189 | MG4 | 1,729 | – 38.5% | 243 | 10,344 | – 49.5% | 219 | 141 |
| 190 | Nissan X-Trail | 1,723 | – 46.6% | 213 | 17,521 | – 33.7% | 172 | 132 |
| 191 | Mazda2 | 1,721 | – 18.9% | 205 | 13,226 | – 21.5% | 198 | 170 |
| 192 | Toyota Urban Cruiser | 1,668 | n/a | 151 | 13,711 | + 342675.0% | 194 | 452 |
| 193 | Audi Q2 | 1,653 | – 56.4% | 191 | 35,538 | + 9.4% | 103 | 111 |
| 194 | Mercedes V Class | 1,648 | – 5.9% | 128 | 21,899 | – 14.3% | 149 | 133 |
| 195 | Range Rover Evoque | 1,640 | – 30.6% | 239 | 13,433 | – 27.5% | 196 | 165 |
| 196 | Mazda CX-60 | 1,617 | – 27.9% | 192 | 12,753 | – 23.5% | 200 | 167 |
| 197 | Skoda Epiq | 1,608 | new | 324 | 1,915 | new | 340 | 812 |
| 198 | Citroen Berlingo | 1,598 | + 89.3% | 189 | 13,527 | + 5.7% | 195 | 197 |
| 199 | Hyundai i30 | 1,590 | – 28.8% | 161 | 18,766 | – 26.4% | 166 | 127 |
| 200 | Hyundai Bayon | 1,583 | – 29.0% | 211 | 14,247 | – 26.0% | 190 | 147 |
| 201 | Renault Rafale | 1,558 | – 22.4% | 214 | 14,781 | – 21.4% | 185 | 151 |
| 202 | BMW ix2 | 1,544 | – 6.8% | 170 | 14,682 | – 24.1% | 187 | 145 |
| 203 | Kia PV5 | 1,539 | + 76850.0% | 199 | 9,103 | + 455050.0% | 228 | 416 |
| 204 | Ford Capri | 1,528 | – 24.2% | 216 | 12,218 | + 5.8% | 202 | 182 |
| 205 | Audi Q6 Sportback | 1,510 | + 41.0% | 196 | 10,452 | + 119.5% | 218 | 234 |
| 206 | Renault Megane E-Tech | 1,491 | + 1.8% | 188 | 15,930 | + 27.6% | 177 | 183 |
| 207 | Hyundai Santa Fe | 1,478 | – 1.7% | 240 | 10,756 | – 0.9% | 215 | 202 |
| 208 | Range Rover | 1,475 | + 43.9% | 245 | 9,401 | + 5.4% | 225 | 217 |
| 209 | Audi Q8 | 1,467 | – 17.0% | 202 | 13,179 | – 25.7% | 199 | 157 |
| 210 | Kia K4 | 1,451 | n/a | 153 | 10,663 | + 177616.7% | 216 | 455 |
| 211 | Mercedes CLE | 1,446 | – 0.7% | 209 | 14,266 | – 12.4% | 189 | 174 |
| 212 | Ford Transit Courier | 1,417 | + 20.8% | 186 | 14,644 | – 12.5% | 188 | 178 |
| 213 | Kia Xceed | 1,399 | – 34.2% | 180 | 18,385 | – 17.1% | 167 | 140 |
| 214 | Cupra Tavascan | 1,393 | – 61.6% | 194 | 20,649 | – 14.1% | 154 | 122 |
| 215 | Leapmotor B05 | 1,388 | new | 236 | 3,156 | new | 309 | – |
| 216 | Volvo S60/V60 | 1,380 | + 5.1% | 247 | 11,194 | – 24.6% | 211 | 177 |
| 217 | BMW i5 | 1,369 | – 25.3% | 165 | 16,196 | – 14.2% | 176 | 142 |
| 218 | Chery Tiggo 9 | 1,284 | + 128300.0% | 256 | 6,726 | + 672500.0% | 253 | 468 |
| 219 | Xpeng G9 | 1,272 | + 275.2% | 184 | 9,322 | + 161.3% | 226 | 270 |
| 220 | Geely EX2 | 1,235 | new | 301 | 1,526 | new | 360 | – |
| 221 | Cupra Ateca | 1,234 | + 67.0% | 296 | 8,671 | + 7.0% | 233 | 225 |
| 222 | Porsche 911 | 1,227 | – 19.2% | 183 | 17,881 | – 1.3% | 168 | 164 |
| 223 | Nissan Leaf | 1,197 | + 4175.0% | 227 | 3,134 | + 164.5% | 311 | 376 |
| 224 | Dacia Logan | 1,176 | – 34.1% | 217 | 6,400 | – 41.7% | 259 | 190 |
| 225 | Mitsubishi Outlander | 1,165 | + 37.9% | 212 | 7,240 | + 57.9% | 248 | 258 |
| 226 | Mercedes S Class | 1,164 | + 146.1% | 220 | 5,030 | + 7.7% | 278 | 274 |
| 227 | Smart #5 | 1,135 | + 205.1% | 226 | 8,396 | + 460.1% | 238 | 307 |
| 228 | Peugeot Partner | 1,126 | + 35.0% | 201 | 9,142 | – 14.3% | 227 | 207 |
| 229 | Ford Transit Connect | 1,108 | – 20.9% | 193 | 11,787 | – 1.1% | 206 | 199 |
| 230 | Ford Transit | 1,094 | + 0.4% | 185 | 14,205 | + 9.3% | 191 | 195 |
| 231 | Leapmotor B03X | 1094 | new | 339 | 1,307 | new | 371 | – |
| 232 | Alpine A290 | 1,090 | + 33.7% | 262 | 8,331 | + 50.9% | 239 | 247 |
| 233 | Lepas L8 | 1,069 | new | n/a | 1,110 | new | 383 | – |
| 234 | Honda CR-V | 1,058 | – 16.1% | 264 | 8,182 | – 17.4% | 240 | 214 |
| 235 | BMW 2 Series Active Tourer | 1,052 | – 43.8% | 254 | 12,120 | – 31.8% | 203 | 168 |
| 236 | Honda Civic | 1,042 | – 31.3% | 233 | 7,529 | + 2.9% | 244 | 231 |
| 237 | DR Motor DR 5.0 | 1,038 | + 11.1% | 248 | 6,334 | – 12.7% | 263 | 240 |
| 238 | Peugeot 408 | 1,038 | – 32.4% | 208 | 11,697 | – 16.8% | 209 | 186 |
| 239 | Mercedes Vito | 1,035 | + 5.7% | 182 | 12,475 | – 13.5% | 201 | 181 |
| 240 | Lexus RZ | 1,031 | + 122.2% | 276 | 5,216 | + 40.2% | 274 | 294 |
| 241 | Mercedes Sprinter | 995 | – 17.3% | 190 | 11,477 | – 7.8% | 210 | 196 |
| 242 | Renault Trafic | 961 | – 10.3% | 215 | 11,839 | – 7.6% | 205 | 188 |
| 243 | Audi Q7 | 959 | – 24.6% | 260 | 10,990 | – 11.2% | 213 | 185 |
| 244 | Skoda Enyaq Coupe | 955 | – 21.8% | 222 | 10,535 | + 16.7% | 217 | 211 |
| 245 | Renault Espace | 949 | – 27.9% | 250 | 11,773 | – 16.0% | 207 | 180 |
| 246 | Seat Ateca | 946 | – 58.1% | 257 | 15,024 | – 21.6% | 181 | 152 |
| 247 | VW ID.5 | 941 | + 8.0% | 225 | 6,938 | – 27.0% | 251 | 213 |
| 248 | BMW IX | 935 | – 41.2% | 219 | 10,160 | – 7.8% | 220 | 189 |
| 249 | BYD Dolphin | 923 | – 7.4% | 228 | 6,971 | – 30.8% | 250 | 212 |
| 250 | Zeekr 7X | 920 | + 138.3% | 242 | 6,282 | + 286.1% | 264 | 314 |
| 251 | Honda ZR-V | 896 | + 41.8% | 266 | 5,308 | – 1.8% | 272 | 249 |
| 252 | Smart #1 | 894 | + 116.5% | 312 | 4,086 | – 5.9% | 291 | 278 |
| 253 | Land Rover Discovery Sport | 876 | + 35.0% | 315 | 5,916 | – 19.4% | 268 | 236 |
| 254 | Toyota Proace City | 868 | + 31.9% | 231 | 7,990 | – 8.2% | 241 | 224 |
| 255 | BMW X7 | 861 | + 0.1% | 246 | 6,538 | + 4.4% | 256 | 243 |
| 256 | Lancia Ypsilon | 857 | + 3.5% | 255 | 8,910 | + 2.3% | 231 | 216 |
| 257 | Ebro S400 | 854 | + 206.1% | 244 | 8,429 | + 1022.4% | 237 | 324 |
| 258 | Ebro S700 | 849 | + 18.4% | 238 | 7,696 | + 67.6% | 243 | 256 |
| 259 | Opel/Vauxhall Vivaro | 838 | + 174.8% | 203 | 8,490 | + 91.9% | 236 | 269 |
| 260 | MG IM5 | 823 | + 362.4% | 293 | 3,458 | + 1739.4% | 303 | 430 |
| 261 | Opel/Vauxhall Combo | 777 | + 126.5% | 259 | 5,250 | – 5.6% | 273 | 257 |
| 262 | Toyota Camry | 760 | + 131.7% | 251 | 3,981 | – 12.7% | 294 | 259 |
| 263 | Kia Sorento | 757 | – 20.6% | 267 | 6,486 | – 31.6% | 258 | 215 |
| 264 | Volvo EC40 | 757 | + 12.3% | 280 | 5,577 | – 15.0% | 269 | 241 |
| 265 | Mercedes G Class | 752 | – 27.6% | 241 | 8,715 | – 9.3% | 232 | 209 |
| 266 | Range Rover Velar | 723 | + 12.8% | 274 | 6,399 | + 0.8% | 260 | 248 |
| 267 | Mercedes EQA | 717 | – 83.9% | 258 | 19,065 | – 39.0% | 163 | 115 |
| 268 | Kia EV9 | 715 | + 7.2% | 253 | 6,493 | – 14.6% | 257 | 229 |
| 269 | Xpeng P7+ | 714 | new | 249 | 2,174 | new | 334 | – |
| 270 | BMW X6 | 688 | – 27.4% | 261 | 6,084 | – 18.2% | 266 | 228 |
| 271 | Lexus ES | 686 | + 24.7% | 316 | 2,490 | – 23.6% | 322 | 292 |
| 272 | Peugeot Expert | 650 | + 10.5% | 229 | 8,562 | + 41.4% | 235 | 246 |
| 273 | Toyota Land Cruiser | 649 | + 49.9% | 285 | 3,649 | – 22.4% | 299 | 266 |
| 274 | Lexus RX | 623 | – 24.9% | 275 | 4,793 | – 8.5% | 280 | 250 |
| 275 | Volvo EX90 | 619 | – 41.7% | 223 | 6,664 | – 25.2% | 254 | 220 |
| 276 | Mazda MX-5 | 613 | – 14.3% | 304 | 5,034 | + 8.7% | 277 | 268 |
| 277 | Citroen Jumper | 604 | + 5.8% | 235 | 9,098 | + 22.3% | 229 | 238 |
| 278 | Land Rover Discovery | 600 | + 19.5% | 334 | 4,061 | + 4.6% | 292 | 286 |
| 279 | Alfa Romeo Tonale | 589 | – 62.2% | 268 | 8,631 | – 30.4% | 234 | 198 |
| 280 | Hyundai Ioniq 9 | 583 | + 46.5% | 298 | 4,016 | + 244.4% | 293 | 332 |
| 281 | VW Touareg | 569 | – 56.7% | 273 | 10,141 | – 0.9% | 221 | 205 |
| 282 | Zeekr 7GT | 566 | n/a | n/a | 1,652 | + 82500.0% | 352 | – |
| 283 | Citroen Jumpy | 557 | – 25.3% | 237 | 8,975 | + 5.0% | 230 | 219 |
| 284 | Renault Kangoo | 551 | – 24.9% | 282 | 6,777 | – 25.6% | 252 | 208 |
| 285 | Mitsubishi ASX | 550 | – 39.9% | 263 | 7,075 | – 18.8% | 249 | 218 |
| 286 | Lynk & Co 08 | 540 | + 119.5% | 279 | 4,522 | + 813.5% | 282 | 350 |
| 287 | Kia Seltos | 533 | new | 265 | 2,254 | new | 329 | – |
| 288 | Kia EV6 | 526 | – 65.0% | 270 | 6,379 | – 54.9% | 261 | 184 |
| 289 | Lexus UX | 524 | – 38.9% | 271 | 5,384 | – 21.3% | 271 | 235 |
| 290 | Skoda Peaq | 518 | new | 349 | 685 | new | 408 | – |
| 291 | Ford Mustang Mach-E | 514 | – 13.2% | 305 | 3,364 | – 20.2% | 304 | 275 |
| 292 | Toyota Proace | 511 | – 22.3% | 234 | 6,354 | – 21.8% | 262 | 222 |
| 293 | Mazda CX-80 | 508 | – 24.7% | 277 | 5,155 | – 19.8% | 276 | 242 |
| 294 | Subaru E-Outback | 474 | new | 287 | 1,356 | new | 368 | – |
| 295 | Honda Super-N | 447 | new | n/a | 566 | new | 419 | – |
| 296 | Smart #3 | 447 | – 1.3% | 302 | 2,859 | – 4.1% | 318 | 297 |
| 297 | Nissan Townstar | 436 | + 71.0% | 294 | 3,101 | – 23.1% | 312 | 285 |
| 298 | DS 7 | 419 | – 58.3% | 278 | 7,271 | – 33.3% | 247 | 204 |
| 299 | Mercedes EQE | 419 | – 35.2% | 327 | 3,476 | – 52.2% | 301 | 237 |
| 300 | KG Mobility Torres | 416 | – 2.3% | 297 | 3,958 | + 11.6% | 295 | 288 |
| 301 | Fiat Qubo | 413 | + 41200.0% | 310 | 1,600 | + 79900.0% | 355 | 790 |
| 302 | MG IM6` | 413 | + 106.5% | 332 | 2,046 | + 874.3% | 337 | 413 |
| 303 | VW Touran | 405 | – 79.4% | 281 | 15,211 | – 22.0% | 180 | 149 |
| 304 | Subaru Uncharted | 399 | new | 306 | 1,857 | new | 343 | – |
| 305 | Hyundai Ioniq 6 | 398 | – 46.9% | 272 | 3,900 | – 12.6% | 298 | 267 |
| 306 | KG Mobility Korando | 398 | – 36.3% | 288 | 5,213 | – 25.8% | 275 | 232 |
| 307 | Fiat Scudo | 396 | – 37.1% | 290 | 3,353 | + 79.9% | 305 | 325 |
| 308 | DR Motor DR 3.0 | 391 | + 252.3% | 402 | 1,962 | + 20.0% | 339 | 335 |
| 309 | KG Mobility Tivoli | 387 | – 19.2% | 308 | 3,921 | – 17.3% | 297 | 263 |
| 310 | Subaru Crosstrek | 383 | – 21.5% | 286 | 4,358 | + 2.3% | 287 | 265 |
| 311 | DS 3 | 379 | – 10.4% | 346 | 2,724 | – 38.5% | 320 | 280 |
| 312 | DS 4 | 374 | – 44.2% | 295 | 5,555 | – 17.7% | 270 | 239 |
| 313 | Zeekr 007 | 373 | + 4562.5% | 218 | 1,193 | + 4488.5% | 376 | 601 |
| 314 | Mercedes GLS | 369 | – 29.4% | 292 | 3,463 | – 19.6% | 302 | 273 |
| 315 | Volvo ES90 | 366 | + 662.5% | 291 | 3,015 | + 2219.2% | 314 | 445 |
| 316 | Nissan Ariya | 365 | – 76.2% | 300 | 4,401 | – 66.9% | 285 | 187 |
| 317 | Lynk & Co 01 | 360 | + 44.0% | 283 | 4,315 | – 15.6% | 289 | 260 |
| 318 | Porsche Taycan | 352 | – 39.2% | 314 | 3,931 | – 23.3% | 296 | 253 |
| 319 | Subaru Forester | 347 | – 34.5% | 269 | 4,178 | – 25.3% | 290 | 254 |
| 320 | VW Crafter | 329 | – 6.8% | 299 | 3,621 | – 9.2% | 300 | 279 |
| 321 | Mitsubishi Grandis | 318 | new | 311 | 4,386 | new | 286 | 458 |
| 322 | Ford Focus | 307 | – 93.5% | 320 | 11,768 | – 77.2% | 208 | 76 |
| 323 | Polestar 3 | 301 | – 37.8% | 362 | 2,384 | – 40.8% | 325 | 283 |
| 324 | BYD Seal 05 | 298 | + 803.0% | 331 | 1,312 | + 857.7% | 370 | 446 |
| 325 | Mitsubishi Eclipse Cross | 296 | + 1750.0% | 347 | 2,206 | – 24.9% | 333 | 313 |
| 326 | GWM Ora 5 | 293 | new | 345 | 518 | new | 426 | – |
| 327 | Volvo EX60 | 293 | new | 318 | 1,496 | new | 362 | – |
| 328 | Alpine A390 | 276 | new | 326 | 1,780 | new | 346 | 542 |
| 329 | Dongfeng Nammi 01 | 256 | + 49.7% | 350 | 1,891 | + 21.8% | 342 | 338 |
| 330 | Mercedes EQE SUV | 255 | – 69.6% | 317 | 3,175 | – 60.1% | 307 | 227 |
| 331 | Lynk & Co 02 | 250 | + 35.1% | 319 | 1,683 | + 67.5% | 350 | 356 |
| 332 | DFSK Forthing 5 | 247 | + 0.4% | 289 | 2,229 | – 5.1% | 331 | 320 |
| 333 | BMW 7 Series | 246 | – 16.0% | 309 | 2,895 | – 18.9% | 317 | 291 |
| 334 | BMW i3 | 244 | + 398.0% | 344 | 700 | + 677.8% | 407 | 507 |
| 335 | BMW XM | 244 | – 55.1% | 307 | 2,218 | – 27.1% | 332 | 303 |
| 336 | Honda Prelude | 235 | new | 348 | 1,744 | new | 347 | – |
| 337 | Ebro S800 | 224 | + 14.9% | 351 | 2,428 | + 43.7% | 323 | 323 |
| 338 | Porsche Panamera | 220 | – 57.1% | 336 | 3,145 | – 30.3% | 310 | 271 |
| 339 | Hyundai Ioniq 3 | 213 | new | 515 | 217 | new | 470 | – |
| 340 | BMW i7 | 212 | – 12.0% | 323 | 1,846 | – 15.6% | 344 | 318 |
| 341 | Maserati Grecale | 212 | – 1.9% | 365 | 1,914 | – 14.9% | 341 | 321 |
| 342 | Mercedes EQS | 212 | + 87.6% | 381 | 880 | – 38.1% | 396 | 345 |
| 343 | Subaru Outback | 204 | – 49.9% | 335 | 3,164 | – 34.7% | 308 | 264 |
| 344 | Ebro S900 | 198 | new | 340 | 1,703 | new | 348 | 494 |
| 345 | Subaru Solterra | 198 | + 340.0% | 330 | 1,459 | + 61.2% | 363 | 366 |
| 346 | Beijing X3 | 195 | + 41.3% | 303 | 1,620 | + 50.8% | 354 | 344 |
| 347 | Renault Arkana | 191 | – 90.0% | 284 | 4,430 | – 77.3% | 283 | 156 |
| 348 | Audi e-Tron GT | 189 | – 5.0% | 359 | 1,671 | + 8.0% | 351 | 336 |
| 349 | KG Mobility Actyon | 183 | + 34.6% | 337 | 2,290 | + 128.1% | 328 | 361 |
| 350 | EVO 5 | 181 | – 57.1% | 379 | 2,367 | – 11.6% | 326 | 310 |
| 351 | DS No 8 | 177 | + 40.5% | 341 | 2,157 | + 195.5% | 335 | 390 |
| 352 | Abarth 600e | 173 | + 203.5% | 370 | 893 | + 45.7% | 394 | 408 |
| 353 | DS No 7 | 171 | new | 313 | 853 | new | 398 | 761 |
| 354 | Jetour Shanhai T2 | 171 | n/a | 354 | 1,363 | + 68050.0% | 367 | 671 |
| 355 | Lamborghini Urus | 171 | – 28.8% | 369 | 1,838 | – 24.7% | 345 | 322 |
| 356 | Fiat Doblo | 170 | – 55.6% | 357 | 1,689 | – 38.9% | 349 | 299 |
| 357 | Mercedes AMG GT | 168 | + 9.8% | 352 | 1,397 | + 2.1% | 365 | 352 |
| 358 | Suzuki Across | 168 | + 143.5% | 383 | 482 | – 26.7% | 430 | 398 |
| 359 | Alfa Romeo Stelvio | 164 | – 71.9% | 321 | 3,035 | – 44.8% | 313 | 252 |
| 360 | Mercedes Citan | 162 | – 63.5% | 329 | 4,881 | – 19.5% | 279 | 245 |
| 361 | Lotus Eletre | 158 | + 3.9% | 395 | 854 | – 25.9% | 397 | 358 |
| 362 | Geely Boyue | 156 | + 95.0% | 333 | 1,382 | + 1091.4% | 366 | 394 |
| 363 | Nissan Primastar | 154 | – 3.8% | 328 | 2,780 | – 3.2% | 319 | 306 |
| 364 | Toyota Prius | 144 | – 55.3% | 391 | 1,163 | – 53.2% | 380 | 319 |
| 365 | Xpeng X9 | 144 | new | – | 730 | new | 405 | – |
| 366 | Mercedes B Class | 142 | – 91.5% | 360 | 4,330 | – 60.7% | 288 | 200 |
| 367 | Polestar 5 | 138 | n/a | 441 | 213 | + 526.5% | 471 | 775 |
| 368 | Bentley Continental | 137 | – 11.6% | 377 | 1,179 | – 11.2% | 377 | 354 |
| 369 | Dongfeng Mage | 134 | + 378.6% | 371 | 1,291 | + 2902.3% | 372 | 560 |
| 370 | Ford Mustang | 134 | – 55.5% | 343 | 2,348 | – 16.4% | 327 | 309 |
| 371 | Citroen C4 X | 132 | – 64.3% | 356 | 2,935 | – 50.0% | 316 | 255 |
| 372 | Peugeot Boxer | 131 | – 29.9% | 322 | 2,398 | – 3.7% | 324 | 317 |
| 373 | DFSK Forthing 4 | 130 | + 25.0% | 338 | 1,135 | – 5.9% | 381 | 355 |
| 374 | Mitsubishi Colt | 130 | – 79.2% | 374 | 2,107 | – 79.8% | 336 | 194 |
| 375 | Hyundai i10 | 128 | – 97.9% | 367 | 9,563 | – 81.5% | 224 | 65 |
| 376 | Alfa Romeo Giulia | 123 | – 51.4% | 363 | 1,274 | – 50.6% | 373 | 308 |
| 377 | Honda E:NY1 | 123 | – 31.7% | 325 | 2,248 | + 59.0% | 330 | 341 |
| 378 | Ford Bronco | 122 | + 52.5% | 372 | 883 | + 46.7% | 395 | 402 |
| 379 | Nio Firefly | 121 | + 611.8% | 388 | 464 | + 728.6% | 431 | 491 |
| 380 | MG Cyberster | 120 | – 23.1% | 368 | 1,085 | – 29.8% | 385 | 339 |
| 381 | Subaru Legacy | 118 | n/a | 415 | 251 | + 12450.0% | 461 | 815 |
| 382 | Zeekr X | 117 | + 225.0% | 382 | 735 | – 11.2% | 404 | 382 |
| 383 | GWM Haval H6 | 113 | + 1783.3% | 364 | 761 | + 888.3% | 402 | 534 |
| 384 | ICH-X K3 | 113 | + 34.5% | 404 | 1,128 | + 618.5% | 382 | 433 |
| 385 | Beijing X5 | 112 | – 42.9% | 401 | 2,552 | + 20.5% | 321 | 315 |
| 386 | Lamborghini Temerario | 111 | n/a | 398 | 634 | + 15750.0% | 411 | 585 |
| 387 | Dongfeng Shine | 110 | + 243.8% | 373 | 1,167 | + 704.8% | 378 | 630 |
| 388 | Hyundai Staria | 109 | – 60.8% | 361 | 1,540 | – 37.9% | 359 | 302 |
| 389 | Renault Twingo | 109 | + 2625.0% | 430 | 273 | + 16.7% | 457 | n/a |
| 390 | Genesis GV70 | 108 | + 163.4% | 417 | 766 | – 3.3% | 401 | 384 |
| 391 | EVO 6 | 104 | + 1.0% | 426 | 1,193 | – 1.0% | 375 | 343 |
| 392 | Genesis GV60 | 97 | + 19.8% | 394 | 929 | + 14.5% | 393 | 388 |
| 393 | Abarth 500e | 95 | – 18.8% | 410 | 590 | – 39.2% | 414 | 367 |
| 394 | Ineos Grenadier | 94 | + 74.1% | 413 | 678 | – 36.0% | 409 | 375 |
| 395 | BMW Z4 | 92 | – 69.0% | 378 | 2,957 | – 34.5% | 315 | 282 |
| 396 | Beijing BJ30 | 90 | + 23.3% | 376 | 777 | + 71.9% | 400 | 420 |
| 397 | BYD Tang | 88 | + 3.5% | 355 | 841 | – 2.7% | 399 | 374 |
| 398 | Ferrari Purosangue | 88 | + 12.8% | 397 | 971 | + 17.6% | 391 | 381 |
| 399 | Dongfeng Vigo | 87 | new | 424 | 267 | new | 458 | – |
| 400 | Audi A2 | 86 | new | 558 | 87 | new | 512 | 866 |
| 401 | Ferrari 12Cilindri | 85 | + 11.8% | 385 | 993 | + 57.4% | 390 | 393 |
| 402 | Renault Master | 85 | + 174.2% | 366 | 1,341 | + 39.7% | 369 | 378 |
| 403 | DR Motor DR 6.0 | 83 | – 77.6% | 375 | 1,440 | – 59.1% | 364 | 290 |
| 404 | Mercedes SL | 83 | – 1.2% | 399 | 959 | – 12.6% | 392 | 372 |
| 405 | Aston Martin DBX | 81 | + 5.2% | 420 | 581 | + 8.0% | 416 | 406 |
| 406 | Mercedes EQV | 80 | – 25.2% | 342 | 1,545 | – 24.1% | 358 | 327 |
| 407 | GWM Haval Jolion | 79 | + 1216.7% | 387 | 556 | + 517.8% | 422 | 618 |
| 408 | Aston Martin Vantage | 78 | – 6.0% | 431 | 565 | + 20.5% | 420 | – |
| 409 | Jeep Wrangler | 78 | – 73.6% | 353 | 1,600 | – 39.9% | 357 | 305 |
| 410 | KG Mobility Rexton | 78 | – 66.2% | 384 | 1,236 | – 31.9% | 374 | 329 |
| 411 | Geely Galaxy E5 | 77 | + 148.4% | 406 | 431 | + 524.6% | 435 | 513 |
| 412 | Aston Martin DB12 | 76 | + 18.8% | 407 | 556 | – 6.4% | 421 | 409 |
| 413 | Ferrari 296 GTB | 75 | + 525.0% | 405 | 438 | + 78.0% | 432 | 471 |
| 414 | Voyah Courage | 70 | + 133.3% | 389 | 426 | + 113.0% | 437 | 448 |
| 415 | Kia Ceed | 68 | – 98.3% | 358 | 7,962 | – 82.5% | 242 | 86 |
| 416 | Mercedes EQS SUV | 67 | – 41.2% | 423 | 535 | – 59.6% | 424 | 353 |
| 417 | Jetour Dasheng | 65 | n/a | 396 | 431 | + 21450.0% | 436 | 656 |
| 418 | Renault Megane | 64 | – 64.2% | 443 | 677 | – 61.0% | 410 | 334 |
| 419 | Bentley Bentayga | 63 | – 7.4% | 437 | 587 | – 2.2% | 415 | 399 |
| 420 | Mercedes EQB | 63 | – 97.8% | 390 | 4,414 | – 82.6% | 284 | 126 |
| 421 | JAC JS6 | 62 | + 6100.0% | 442 | 235 | + 23400.0% | 465 | n/a |
| 422 | Lotus Emeya | 60 | – 13.0% | 446 | 340 | + 6.9% | 448 | 440 |
| 423 | Hongqi E-HS7 | 58 | – 6.5% | 492 | 126 | – 68.8% | 491 | 423 |
| 424 | Ferrari Amalfi | 57 | new | 403 | 543 | new | 423 | 668 |
| 425 | Alpine A110 | 56 | – 65.2% | 393 | 1,634 | + 1.3% | 353 | 330 |
| 426 | JAC JS8 | 55 | + 1275.0% | 429 | 435 | + 3007.1% | 434 | 684 |
| 427 | Audi A8 | 49 | – 71.7% | 436 | 1,015 | – 32.6% | 388 | 337 |
| 428 | Ferrari 296 GTS | 47 | – 48.4% | 428 | 365 | – 67.4% | 444 | 364 |
| 429 | Jetour X70 | 47 | n/a | 409 | 348 | + 17300.0% | 447 | 661 |
| 430 | Zeekr 001 | 47 | – 40.5% | 456 | 612 | + 7.4% | 412 | 386 |
| 431 | Chevrolet Corvette | 46 | + 35.3% | 448 | 293 | – 69.4% | 453 | 387 |
| 432 | EVO 3 | 45 | – 63.7% | 425 | 745 | – 31.1% | 403 | 357 |
| 433 | Renault Kangoo E-Tech | 45 | + 36.4% | 447 | 581 | + 18.8% | 417 | n/a |
| 434 | Beijing X7 | 44 | – 64.5% | 416 | 1,001 | – 5.8% | 389 | 360 |
| 435 | Rolls Royce Cullinan | 43 | + 4.9% | 435 | 382 | – 9.5% | 441 | 431 |
| 436 | Sportequipe 6 | 42 | – 70.4% | 457 | 1,082 | + 0.8% | 386 | 359 |
| 437 | Suzuki Jimny | 40 | – 54.5% | 411 | 567 | + 252.2% | 418 | 467 |
| 438 | JAC E30X | 39 | + 11.4% | 419 | 516 | + 146.9% | 429 | 443 |
| 439 | DFSK Fengon E5 | 38 | – 75.0% | 392 | 716 | – 62.8% | 406 | 328 |
| 440 | Lamborghini Revuelto | 38 | + 11.8% | 421 | 517 | + 13.1% | 428 | 451 |
| 441 | Lotus Emira | 38 | – 26.9% | 444 | 360 | – 23.7% | 445 | 426 |
| 442 | Fiat Grizzly | 37 | new | 570 | 54 | new | 529 | – |
| 443 | DFSK Seres SF5 | 35 | – 63.5% | 418 | 244 | – 38.2% | 462 | 429 |
| 444 | Bentley Flying Spur | 33 | – 10.8% | 468 | 208 | – 20.6% | 472 | 461 |
| 445 | DFSK Forthing 3 | 33 | + 17.9% | 462 | 141 | + 135.0% | 485 | 533 |
| 446 | Dongfeng Shine GS | 32 | new | 510 | 258 | new | 460 | – |
| 447 | Lancia Gamma | 32 | new | 466 | 94 | new | 510 | – |
| 448 | Hongqi HS5 | 31 | + 93.8% | 439 | 238 | + 1222.2% | 463 | 541 |
| 449 | Nio EL6 | 31 | + 6.9% | 467 | 170 | – 13.7% | 478 | 453 |
| 450 | Tiger Six | 31 | – 24.4% | 464 | 533 | + 0.9% | 425 | 392 |
| 451 | Xpeng L03 | 30 | new | – | 30 | new | 551 | – |
| 452 | Denza Z9 GT | 29 | + 2800.0% | 471 | 63 | + 1475.0% | 520 | 598 |
| 453 | EVO Cuatro | 28 | – 37.8% | 438 | 1,165 | + 2488.9% | 379 | 511 |
| 454 | DFSK Forthing 7 | 27 | + 2600.0% | 432 | 231 | + 1440.0% | 467 | – |
| 455 | Mercedes AMG GT 4 Door | 27 | – 15.6% | 386 | 301 | – 53.4% | 452 | n/a |
| 456 | Nio ET5 | 27 | – 71.6% | 449 | 95 | – 62.3% | 508 | 442 |
| 457 | Cadillac Lyriq | 26 | + 271.4% | 408 | 151 | – 56.5% | 482 | 449 |
| 458 | EVO 7 | 26 | – 23.5% | 484 | 276 | – 0.4% | 456 | 434 |
| 459 | McLaren 750S | 26 | + 271.4% | 479 | 144 | – 10.0% | 484 | 498 |
| 460 | Porsche 718/Boxster/Cayman | 26 | – 92.3% | 427 | 604 | – 81.1% | 413 | 301 |
| 461 | BMW X4 | 25 | – 97.4% | 465 | 1,103 | – 85.5% | 384 | 230 |
| 462 | Cadillac Escalade | 25 | – 3.8% | 454 | 200 | + 49.3% | 475 | 485 |
| 463 | Dongfeng Huge | 24 | + 14.3% | 483 | 259 | + 661.8% | 459 | 593 |
| 464 | Fiat Tipo | 24 | – 91.3% | 434 | 1,973 | – 60.4% | 338 | 262 |
| 465 | Dacia Striker | 23 | new | 482 | 32 | new | 546 | – |
| 466 | Voyah Free | 23 | + 35.3% | 453 | 206 | – 34.6% | 474 | 457 |
| 467 | JAC J7 | 22 | n/a | 473 | 282 | + 14000.0% | 454 | 572 |
| 468 | Ferrari 849 Testarossa | 21 | new | 455 | 235 | new | 464 | 711 |
| 469 | Hongqi HS3 | 20 | + 53.8% | 452 | 208 | + 994.7% | 473 | 545 |
| 470 | Renault Koleos | 20 | + 566.7% | – | 33 | + 120.0% | 544 | 653 |
| 471 | Sportequipe 7 | 20 | + 25.0% | 476 | 321 | – 20.0% | 450 | 427 |
| 472 | Aston Martin Vanquish | 19 | – 20.8% | 481 | 181 | – 10.4% | 476 | 476 |
| 473 | Jeep Renegade | 19 | – 96.9% | 422 | 1,600 | – 82.0% | 356 | 221 |
| 474 | DFSK Fengon 500 | 18 | – 71.4% | 460 | 435 | – 53.9% | 433 | 370 |
| 475 | Dodge Durango | 18 | – 25.0% | 469 | 126 | – 49.2% | 489 | 465 |
| 476 | Sportequipe 8 | 18 | + 800.0% | 458 | 401 | + 1193.5% | 439 | 524 |
| 477 | Dodge Charger | 17 | + 240.0% | 433 | 94 | + 42.4% | 509 | 553 |
| 478 | Citroen C5 X | 16 | – 80.2% | 445 | 232 | – 85.5% | 466 | 346 |
| 479 | Kia Proceed | 16 | – 84.9% | 461 | 281 | – 89.5% | 455 | 316 |
| 480 | Chevrolet Suburban | 15 | + 87.5% | 503 | 92 | + 130.0% | 511 | 566 |
| 481 | EVO Spazio | 15 | new | 511 | 114 | new | 497 | 562 |
| 482 | GWM Wey 05 | 15 | – 65.1% | 472 | 152 | – 78.4% | 480 | 405 |
| 483 | Genesis G80 | 13 | + 333.3% | 536 | 72 | – 32.1% | 517 | 522 |
| 484 | Hongqi E-HS5 | 13 | new | 450 | 126 | new | 490 | – |
| 485 | Maserati GranTurismo | 13 | + 8.3% | 499 | 119 | – 55.3% | 494 | 466 |
| 486 | Opel/Vauxhall Movano | 13 | – 51.9% | 463 | 231 | – 47.6% | 468 | 437 |
| 487 | VW ID.Cross | 13 | new | 507 | 46 | new | 533 | – |
| 488 | Beijing BJ40 | 12 | + 140.0% | 487 | 122 | + 771.4% | 493 | 582 |
| 489 | DFSK Fengon 600 | 12 | – 74.5% | 477 | 224 | – 45.5% | 469 | 428 |
| 490 | Jeep Grand Cherokee | 12 | – 87.2% | 380 | 394 | – 52.1% | 440 | 383 |
| 491 | McLaren Artura | 12 | – 14.3% | 506 | 104 | – 44.1% | 506 | 487 |
| 492 | GWM Wey 03 | 11 | – 60.7% | 475 | 106 | – 65.7% | 503 | 454 |
| 493 | Maserati GranCabrio | 11 | – 8.3% | 505 | 105 | – 11.0% | 504 | 514 |
| 494 | Chevrolet Tahoe | 10 | + 11.1% | 489 | 86 | + 28.4% | 514 | 540 |
| 495 | Chrysler Pacifica | 10 | + 150.0% | 504 | 53 | + 12.8% | 530 | 559 |
| 496 | DFSK Forthing 9 | 10 | – 50.0% | 459 | 130 | + 103.1% | 488 | 544 |
| 497 | GWM Haval H7 | 10 | new | – | 10 | new | 593 | – |
| 498 | Opel/Vauxhall Zafira/Tourer | 10 | + 400.0% | 551 | 32 | + 966.7% | 548 | 752 |
| 499 | Volvo S90/V90 | 10 | – 98.4% | 491 | 358 | – 93.4% | 446 | 261 |
| 500 | Dongfeng M-Hero 1 | 9 | n/a | 566 | 28 | + 100.0% | 553 | 667 |
| 501 | GWM Haval Chitu | 9 | – 43.8% | 575 | 134 | + 4.7% | 487 | 492 |
| 502 | Rolls-Royce Ghost | 9 | + 0.0% | 480 | 103 | + 2.0% | 507 | 517 |
| 503 | Audi Q9 | 8 | + 14.3% | 501 | 57 | – 13.6% | 524 | – |
| 504 | BMW iX5 | 8 | n/a | 440 | 108 | + 151.2% | 502 | 556 |
| 505 | DR Motor DR 7.0 | 8 | – 81.8% | 474 | 316 | + 91.5% | 451 | 486 |
| 506 | EVO 4 | 8 | – 91.0% | 532 | 327 | – 22.1% | 449 | 422 |
| 507 | Ford Ranger | 8 | + 166.7% | 524 | 34 | + 54.5% | 542 | 614 |
| 508 | ICH-X K2 | 8 | – 20.0% | 540 | 109 | + 29.8% | 501 | 530 |
| 509 | Ferrari Roma | 7 | – 90.4% | 478 | 369 | – 50.5% | 442 | 391 |
| 510 | Fiat Punto | 7 | – 30.0% | 534 | 60 | + 13.2% | 521 | 564 |
| 511 | Lexus LM | 7 | – 82.9% | 485 | 152 | – 65.6% | 481 | 439 |
| 512 | Aston Martin Valhalla | 6 | new | 486 | 114 | new | 496 | 675 |
| 513 | Beijing BJ60 | 6 | – 14.3% | 495 | 77 | + 35.1% | 516 | 555 |
| 514 | Chevrolet Camaro | 6 | – 72.7% | 519 | 58 | – 46.3% | 522 | 519 |
| 515 | Dongfeng M-Hero 2 | 6 | new | 521 | 11 | new | 585 | – |
| 516 | Rolls-Royce Spectre | 6 | – 72.7% | 530 | 111 | – 40.3% | 499 | 483 |
| 517 | Cadillac Vistiq | 5 | + 400.0% | 518 | 11 | + 266.7% | 584 | 724 |
| 518 | Chevrolet Silverado | 5 | + 25.0% | 564 | 22 | – 12.0% | 561 | 594 |
| 519 | Ferrari F80 | 5 | n/a | 522 | 56 | + 1300.0% | 527 | 742 |
| 520 | Hongqi H6 | 5 | new | 470 | 65 | new | 519 | – |
| 521 | Mercedes VLE | 5 | new | 414 | 178 | new | 477 | – |
| 522 | Nio EL8 | 5 | + 25.0% | 529 | 30 | – 64.3% | 550 | 527 |
| 523 | Subaru Impreza | 5 | – 68.8% | 493 | 66 | – 58.0% | 518 | 496 |
| 524 | Suzuki Swace | 5 | – 96.9% | 412 | 1,077 | – 60.2% | 387 | 311 |
| 525 | Tesla Model S | 5 | – 50.0% | 494 | 518 | + 70.4% | 427 | 436 |
| 526 | Audi A4 | 4 | – 90.5% | 559 | 43 | – 98.7% | 535 | 304 |
| 527 | Audi A7 | 4 | – 96.6% | – | 49 | – 97.8% | 531 | 331 |
| 528 | BYD Fang Cheng Bao Bao 5 | 4 | new | 561 | 5 | new | 638 | – |
| 529 | Fiat Grizzly Fastback | 4 | new | – | 24 | new | 557 | – |
| 530 | Hongqi H5 | 4 | + 300.0% | 539 | 41 | + 4000.0% | 536 | 768 |
| 531 | Lamborghini Huracan | 4 | + 0.0% | 543 | 32 | – 88.0% | 547 | 473 |
| 532 | Maserati MC20 | 4 | – 33.3% | 516 | 56 | – 49.1% | 528 | 516 |
| 533 | Maxus Deliver 9 | 4 | + 300.0% | 545 | 27 | – 12.9% | 556 | 590 |
| 534 | Denza D9 | 3 | + 200.0% | – | 12 | + 300.0% | 579 | 726 |
| 535 | DFSK Seres 3 | 3 | – 86.4% | 496 | 58 | – 71.0% | 523 | 469 |
| 536 | Dodge Challenger | 3 | – 92.7% | 509 | 110 | – 74.5% | 500 | 435 |
| 537 | Ferrari SF90 | 3 | – 90.9% | 533 | 146 | – 70.0% | 483 | 419 |
| 538 | Fiat 500X | 3 | + 0.0% | 497 | 138 | – 51.6% | 486 | 460 |
| 539 | Ford Fiesta | 3 | + 200.0% | 535 | 28 | – 20.0% | 554 | 589 |
| 540 | JAC J6 | 3 | + 200.0% | 498 | 9 | + 800.0% | 604 | – |
| 541 | Maxus Euniq 6 | 3 | – 70.0% | 528 | 57 | – 68.2% | 525 | 490 |
| 542 | Mercedes Actros | 3 | – 25.0% | 546 | 35 | – 22.2% | 540 | 575 |
| 543 | Nissan Interstar | 3 | n/a | 595 | 21 | + 950.0% | 562 | 681 |
| 544 | Suzuki Ignis | 3 | – 87.5% | 607 | 19 | – 99.6% | 565 | 277 |
| 545 | Toyota 4-Runner | 3 | n/a | 608 | 11 | + 266.7% | 588 | 817 |
| 546 | Toyota Aygo | 3 | + 200.0% | 609 | 24 | – 29.4% | 558 | n/a |
| 547 | Toyota Highlander | 3 | – 70.0% | 554 | 20 | – 94.0% | 563 | 456 |
| 548 | Toyota Supra | 3 | – 87.0% | 500 | 116 | – 26.1% | 495 | 489 |
| 549 | Voyah Passion | 3 | + 50.0% | 613 | 9 | – 10.0% | 608 | 628 |
| 550 | VW Atlas | 3 | – 57.1% | 614 | 35 | – 22.2% | 541 | 565 |
| 551 | Abarth 595, 695 | 2 | + 0.0% | 531 | 11 | – 93.3% | 583 | 505 |
| 552 | Cadillac Optiq | 2 | – 80.0% | 488 | 33 | + 22.2% | 543 | 602 |
| 553 | Denza Z9 | 2 | new | – | 3 | new | 674 | – |
| 554 | DFSK Fengon 5 | 2 | – 77.8% | 565 | 29 | – 74.3% | 552 | 510 |
| 555 | Fiat Brava | 2 | + 0.0% | 569 | 19 | + 5.6% | 564 | 595 |
| 556 | Geely Binyue | 2 | – 98.1% | 512 | 111 | – 90.2% | 498 | 368 |
| 557 | Geely Monjaro | 2 | new | – | 2 | new | 723 | – |
| 558 | GWM Ora 03 | 2 | – 98.9% | 513 | 48 | – 97.3% | 532 | 342 |
| 559 | Honda Accord | 2 | n/a | 526 | 15 | + 200.0% | 573 | 713 |
| 560 | Honda Odyssey | 2 | n/a | 527 | 10 | + 233.3% | 594 | 747 |
| 561 | Honda Pilot | 2 | n/a | – | 4 | n/a | 657 | – |
| 562 | Hongqi H9 | 2 | n/a | 514 | 28 | + 2700.0% | 555 | 908 |
| 563 | KG Mobility Musso | 2 | new | – | 10 | new | 595 | – |
| 564 | Lada Niva | 2 | – 60.0% | 542 | 30 | – 28.6% | 549 | 580 |
| 565 | McLaren GTS | 2 | + 0.0% | – | 18 | – 28.0% | 568 | 608 |
| 566 | Nissan Rogue | 2 | n/a | 596 | 12 | + 500.0% | 582 | 851 |
| 567 | Rolls-Royce Phantom | 2 | n/a | 517 | 45 | + 40.6% | 534 | 581 |
| 568 | Smart Fortwo | 2 | – 75.0% | – | 36 | – 76.0% | 539 | 503 |
| 569 | Tesla Model X | 2 | – 85.7% | – | 416 | – 8.2% | 438 | 418 |
| 570 | Toyota Sienna | 2 | n/a | – | 13 | + 85.7% | 578 | 693 |
| 571 | Voyah Taishan | 2 | new | – | 2 | new | 758 | – |
| 572 | VW ID.Tiguan | 2 | new | – | 2 | new | 759 | – |
| 573 | Zeekr 9X | 2 | new | – | 11 | new | 592 | – |
| 574 | Alfa Romeo 147 | 1 | + 0.0% | – | 2 | – 33.3% | 705 | 777 |
| 575 | Alfa Romeo Giulietta | 1 | + 0.0% | – | 4 | – 50.0% | 652 | 688 |
| 576 | Aston Martin DBS | 1 | n/a | – | 2 | – 66.7% | 706 | – |
| 577 | Audi Q8 e-Tron Sportback | 1 | – 90.0% | – | 4 | – 99.3% | 653 | 421 |
| 578 | Audi TT | 1 | n/a | – | 5 | – 86.5% | 637 | 592 |
| 579 | Bentley Arnage | 1 | new | – | 1 | new | 765 | – |
| 580 | BMW 8 Series | 1 | – 99.6% | 502 | 164 | – 91.1% | 479 | 333 |
| 581 | Cadillac XT4 | 1 | n/a | – | 1 | – 91.7% | 771 | 657 |
| 582 | Chevrolet Impala | 1 | n/a | – | 1 | n/a | 774 | – |
| 583 | Chevrolet Spark | 1 | n/a | – | 2 | n/a | 713 | – |
| 584 | Chevrolet Trailblazer | 1 | n/a | – | 3 | + 200.0% | 671 | 881 |
| 585 | Chevrolet Traverse | 1 | n/a | – | 7 | + 133.3% | 615 | 725 |
| 586 | Citroen C2 | 1 | n/a | – | 2 | + 100.0% | 714 | 886 |
| 587 | Citroen C3 Picasso | 1 | n/a | – | 1 | + 0.0% | 778 | 826 |
| 588 | Dacia Lodgy | 1 | n/a | – | 3 | n/a | 672 | – |
| 589 | DFSK Fengon 580 | 1 | – 90.0% | 520 | 17 | – 93.3% | 570 | 477 |
| 590 | Dodge Grand Caravan | 1 | n/a | – | 3 | + 50.0% | 675 | 829 |
| 591 | Ferrari 812 Superfast | 1 | + 0.0% | – | 5 | – 44.4% | 639 | – |
| 592 | Ferrari Daytona | 1 | – 87.5% | – | 6 | – 91.7% | 629 | 536 |
| 593 | Fiat Seicento | 1 | n/a | – | 2 | + 100.0% | 719 | 764 |
| 594 | Fiat Topolino | 1 | n/a | – | 7 | + 75.0% | 619 | 765 |
| 595 | Fiat Ulysse | 1 | n/a | – | 2 | n/a | 721 | 395 |
| 596 | Ford Bronco Sport | 1 | – 75.0% | – | 9 | – 69.0% | 603 | 596 |
| 597 | Ford C-Max | 1 | + 0.0% | – | 4 | + 0.0% | 655 | 766 |
| 598 | Ford Escape | 1 | n/a | 523 | 11 | + 37.5% | 586 | 678 |
| 599 | Ford F-150 | 1 | – 96.9% | – | 8 | – 97.1% | 609 | 464 |
| 600 | Ford F-450 | 1 | n/a | – | 1 | n/a | 798 | – |
| 601 | Ford Fusion | 1 | n/a | – | 1 | + 0.0% | 799 | 898 |
| 602 | Geely Galaxy Starship 7 | 1 | new | 525 | 87 | new | 513 | – |
| 603 | Genesis GV80 | 1 | n/a | – | 1 | – 99.0% | 804 | 529 |
| 604 | GWM Haval Dagou | 1 | – 66.7% | – | 2 | – 75.0% | 724 | 697 |
| 605 | GWM Ora 07 | 1 | – 85.7% | 576 | 13 | – 72.3% | 576 | 570 |
| 606 | Hyundai Elantra | 1 | n/a | 579 | 4 | – 93.5% | 658 | 563 |
| 607 | Hyundai Nexo | 1 | n/a | 580 | 18 | + 157.1% | 567 | 715 |
| 608 | Hyundai Palisade | 1 | n/a | 581 | 5 | + 150.0% | 643 | 795 |
| 609 | Hyundai Sonata | 1 | n/a | – | 5 | + 25.0% | 644 | 770 |
| 610 | Jaguar i-Pace | 1 | n/a | – | 3 | – 99.8% | 686 | 351 |
| 611 | Jeep Grand Wagoneer | 1 | n/a | 583 | 7 | + 133.3% | 622 | 670 |
| 612 | Jetour Traveller | 1 | n/a | – | 3 | + 200.0% | 688 | – |
| 613 | Kia Carnival | 1 | + 0.0% | – | 3 | + 200.0% | 689 | 915 |
| 614 | Kia Optima | 1 | n/a | – | 2 | n/a | 730 | – |
| 615 | Kia Rio | 1 | – 98.6% | – | 9 | – 98.9% | 606 | 397 |
| 616 | Kia Stinger | 1 | n/a | – | 1 | – 50.0% | 818 | 839 |
| 617 | Lancia Delta | 1 | + 0.0% | 585 | 6 | + 0.0% | 630 | 700 |
| 618 | Lexus GX | 1 | + 0.0% | – | 1 | – 83.3% | 822 | 685 |
| 619 | Maserati Quattroporte | 1 | + 0.0% | – | 6 | – 33.3% | 631 | 686 |
| 620 | Maxus Mifa 7 | 1 | + 0.0% | – | 5 | + 0.0% | 647 | 718 |
| 621 | Mazda CX-3 | 1 | n/a | – | 2 | – 60.0% | 738 | 719 |
| 622 | Mazda CX-90 | 1 | n/a | – | 3 | n/a | 691 | – |
| 623 | McLaren GT | 1 | – 50.0% | – | 3 | – 81.3% | 692 | 641 |
| 624 | McLaren MP4-12C | 1 | n/a | – | 2 | + 100.0% | 740 | 933 |
| 625 | Mercedes AMG PureSpeed | 1 | n/a | 548 | 12 | n/a | 581 | 847 |
| 626 | Mercedes CLS | 1 | n/a | – | 2 | – 90.0% | 741 | 634 |
| 627 | Mercedes EQT | 1 | – 75.0% | – | 41 | – 78.8% | 537 | 484 |
| 628 | MG TF | 1 | n/a | – | 2 | n/a | 743 | – |
| 629 | Nissan Armada | 1 | + 0.0% | – | 7 | + 250.0% | 625 | 807 |
| 630 | Nissan Terrano | 1 | – 66.7% | – | 2 | – 75.0% | 747 | 682 |
| 631 | Nissan Z | 1 | n/a | – | 6 | + 200.0% | 633 | 808 |
| 632 | RAM 1500 | 1 | n/a | 601 | 3 | + 0.0% | 698 | 811 |
| 633 | Skoda Citigo | 1 | n/a | 603 | 2 | n/a | 753 | 961 |
| 634 | Subaru Ascent | 1 | n/a | – | 1 | + 0.0% | 854 | 962 |
| 635 | Subaru WRX STI | 1 | n/a | 606 | 5 | + 66.7% | 650 | 816 |
| 636 | Toyota Mirai | 1 | + 0.0% | 610 | 15 | – 97.3% | 574 | 425 |
| 637 | Toyota Tacoma | 1 | n/a | – | 6 | – 53.8% | 635 | 648 |
| 638 | VW Golf Plus | 1 | n/a | – | 1 | n/a | 859 | – |
| 639 | VW Talagon | 1 | + 0.0% | – | 1 | – 80.0% | 860 | 758 |
| 640 | Xpeng P7 | 1 | – 96.6% | – | 57 | – 83.3% | 526 | 447 |
| – | Other | 5,316 | + 171.1% | 35,916 | + 100.5% | – | – |
Source: Dataforce

Related Posts
Teslas are very good, which is why people buy them. They are profitable, affordable, and partly manufactured in Germany, which is great news. Just look at the massive shift of automotive production to Eastern Europe: over a million cars are produced annually in Slovakia, compared to less than half a million in Italy.
So, it’s worth taking a look at how Musk does it and perhaps saving some jobs therewhere these car companies originated. Europeans love tradition.
Oh, and regarding the European internet: sometime around 2029, we’ll have a few satellites up and be able to compete with Starlink. “Good news” for Ukraine and its soldiers. One might be tempted to say: buy Teslas and support Starlink to help this poor country.
Everything I said is a fact. Your responses (ymca and rick m) only confirm what I stated, you resort to insults because you cannot cope with reality. Poor Europe, so many europeans have an inferiority complex toward the U.S. The United States is the primary pillar of Europe’s prosperity and the leading military force within NATO, which is what has guaranteed peace in Europe since the Second World War. Any European who hates the U.S. is a hypocrite. This are all facts.
No one confirms what you ‘stated’ ;)) Seek help, silly boy. Your disorder has a name: OCD.
“Everything I said is a fact” … in your own trivial N = 1 biotope.
For the record: If you sincerely feel you are the Fountain of Wisdom, the Chosen One, Mr nit All, may I suggest Substack? (“Thx Rick, you rock!”).
Neat platform to evangelize your Divine Beliefs. Might be two lost souls even subscribe! OMG, the exhilaration!!
PS: none of the above is an insult but merely facts. YOU are an insult the Matt and those who want to engage in the sharing of AUTOMOTIVE matters
Pavel and BryanR
Have you guys thought about moving off to the US or india?
It’s pretty pathetic one feels the urge to repeatedly mis-use BSCB to annoy intelligent readers with lengthy brain dumps and ideological drivel. Guess it’s a lonely life, up there in that depressing attic …
BryanR and Pavel, are you two sure you’re Europeans? You two sound very fishy.
The United States, Australia, the United Kingdom, Ireland, France, Canada, Switzerland, India, and New Zealand are the great defenders of the free and prosperous World, which represents the higher point in the History of Humanity.
Historically, Europeans have always been deeply hypocritical, and they will continue to be so. They condemn putin (rightly sou) yet they support netanyahu, who is doing far worse. They are constantly badmouthing the U.S. and Americans, even though the U.S. is, by far, Europe’s greatest military protector and its largest economic partner, without whom europeus would be very much poorer. Europe was brought into a state of civilization by the U.S. through peace and economic development after the WWII yet europeans consider themselves superior, simply because they say so. It’s so sad. As a european I say, I grew up and lived in the best, most prosperous, and most peaceful place in the history of Europe, all because of you, USA.THANK YOU THE USA
You said a lot of things. Of course Europeans are thankful for the US help after WW2. And USA and Europe have mostly been great allies in many ways. I rarely heard people badmouthing them before. But this incompetent administration wouldn‘t have done this after WW2 and deserve all badmouthing. The americans often feel superior, too. And honestly that’s as wrong. Because they‘re not. And I’m also very sure most people hope that Natanjahu will be gone soon and hope for someone better.
There’s no comparison, europeans are far more arrogant than Americans, but it has always been this way, especially with europeans from western and continental Europe. If you look around, you’ll find many more Europeans speaking ill of the U.S. than the other way around. Actually, Americans love Europe, not to be confused with the european union which is a mess. Yet, Americans have far more reason to be proud of their country, given that Europe is much more dependent on the U.S. than vice versa. Europe is only what it is today because the U.S. sustains it, both through military investment and trade, which is highly beneficial to Europe. And the current administration has absolutely nothing to do with this, what I’m describing was already the case long before. This administration will be only in power for four years, a mere blip in the grand timeline of the United States.
When will people learn. A Tesla purchase is a show of support for Russia and Vladimir Putin. Might as well buy a Lada…
People also buy Chinese cars. Tesla developed great electric car, which Chinese brands have largely copied. Without Tesla, we would buy more oil from Russia or other “democratic” regimes.
Unfortunately, the American support for Ukraine is forgotten. Without Musk, Ukraine would defend itself very poorly. Or will the Europeans offer Ukraine better internet or stop buying Russian oil and gas?
In Europe, discussion isn’t completely fair.
Does anyone know where the 20-year-old Citroen C2 (#586) was registered?
The New Hyundai Tucson looks awesome
[…] Best Selling Cars Blog: Europe September 2026 […]
Skoda will have very bad October. Cables from destroyed Ukrainian factory are still missing. Production has dropped.
VinFast is missing from the table. A Czech carrier revealed that it transported a larger number of VF6 models to Sweden for the Green SM taxi service. They should be reflected in Swedish sales in October at once. Perhaps the only chance to sell cars of this brand. It’s a mystery why they were loaded in Austria.
Local manufacturers are quickly adapting to the new conditions. Hyundai will strengthen with the new Tucson. This is a key model for sales.
Although the new Tucson looks horrible to me after this really good-designed generation. On the other hand the second gen Skoda Kodiaq is also butt-ugly and way worse looking than the first and still sells great…
Agree with both.
Btw, surprised VinFast isn’t ranked, but I am sure it will next month
Vinfast is categorised as “Others” in this dataset.