skip to Main Content

South Africa June 2026: Highest market in 19 years, Toyota Land Cruiser FJ inside Top 50

The Toyota Land Cruiser FJ makes its first appearance in any world ranking.

The South African new vehicle market lodges a 20th consecutive month of year-on-year gain in June at +15.3% to 54,482 units. This is also the 5th straight month of double-digit YoY lifts. This month market the best June volume in 19 years: since 2007. The year-to-date tally halfway through the year stands at 315,303 units, up 12.9% on 2025. Strikingly, the Top 6 manufacturers all trail the market, with GWM (+14%), the VW Group (+12.8%) and Suzuki (+9%) faring best, followed by Toyota (+6.2%) and Hyundai (+2.8%) whereas Ford (-3.2%) is actually down. Chery (+23.8%) shines at #7 but once again it’s Jetour (+200.7%) that delivers the performance of the month, beating its monthly volume record for an incredible 17th straight time (every month since its launch) at 2,054. Newcomer BYD advances to a record 15th position.

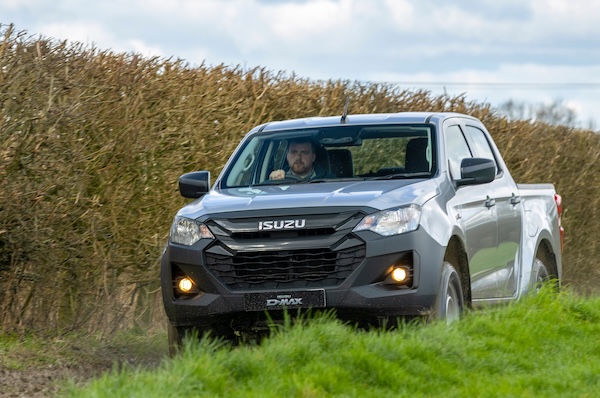
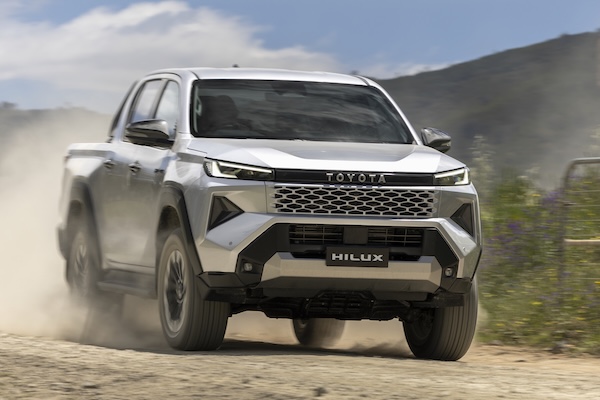
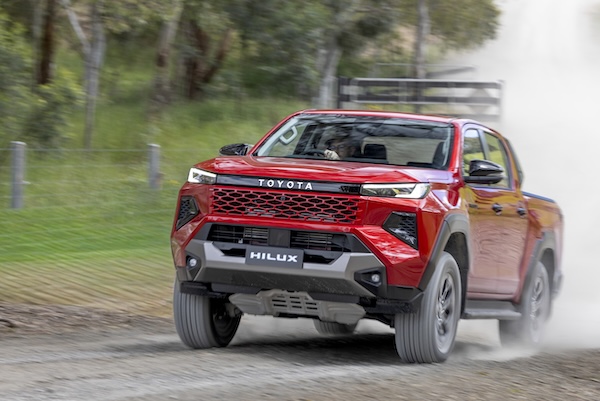
Over in the models charts, the Toyota Hilux (+14.1%) scores a 17th consecutive month at #1 with 6.4% share, distancing the VW Polo Vivo (+22.1%), Ford Ranger (-7.2%) and Chery Tiggo 4 (+34.6%), making the Top 4 unchanged on last month. The Isuzu D-Max (+2.7%) is back up six spots on May to #5 ahead of the Hyundai Grand i10 (+9.6%) and GWM Haval Jolion (+27.6%). The Toyota Urban Cruiser (+63.1%) soars from outside the May Top 50 directly into 10th place, with the Suzuki Ertiga (+36.9%) also in great shape at #11. The new Jetour T2 falls to #15 after hitting its first Top 10 finish last month. Finally the new Toyota Land Cruiser FJ directly breaks into the Top 50 at #50, in what is its first appearance in any world ranking.

Previous month: South Africa May 2026: Jetour breaks records, places T2 inside Top 10 for the first time

One year ago: South Africa June 2025: 4th straight double digit market gain (+18.7%)

Full June 2026 Top 47 All manufacturers and Top 50 models below.

South Africa June 2026 – manufacturers:

PosManufacturerJun-26%/25May2026%/25PosFY25
1Toyota12,41722.8%+ 6.2%170,65322.4%+ 4.0%11
2Suzuki5,68910.4%+ 9.0%234,61711.0%+ 0.5%22
3Volkswagen Group5,61310.3%+ 12.9%330,9659.8%+ 5.4%33
4Hyundai2,9865.5%+ 2.8%418,3395.8%+ 1.3%44
5Ford2,9615.4%– 3.2%517,0295.4%+ 3.6%55
6GWM (incl. Haval)2,6084.8%+ 14.0%615,6105.0%+ 31.9%66
7Chery2,6024.8%+ 23.8%714,5934.6%+ 24.9%78
8Isuzu2,1213.9%+ 1.6%1012,3013.9%+ 0.7%87
9Jetour2,0543.8%+ 200.7%810,8693.4%+ 228.8%915
10Mahindra1,6693.1%+ 12.5%910,1433.2%+ 5.5%1010
11Kia1,4162.6%+ 15.1%139,2502.9%+ 12.3%119
12Omoda and Jaecoo1,4162.6%+ 40.3%118,3112.6%+ 62.4%1214
13Renault1,3262.4%+ 0.6%148,0282.5%– 1.8%1311
14BMW Group1,3142.4%– 2.6%127,9482.5%+ 5.6%1413
15BYD8001.5%new172,8420.9%new21 –
16Nissan7791.4%– 34.2%166,2672.0%– 20.1%1512
17Stellantis7321.3%+ 13.0%154,1411.3%+ 28.4%1616
18Tata PC6141.1%new182,2690.7%new22 –
19Foton5201.0%+ 97.0%213,0521.0%+ 132.4%2019
20FAW Trucks5040.9%+ 12.0%193,0611.0%+ 18.9%1918
21Mercedes4910.9%– 10.1%203,1031.0%+ 2.0%1817
22MG4610.8%new223,2321.0%new1724
23JAC3280.6%+ 49.1%231,8550.6%+ 42.6%2322
24Scania3120.6%+ 45.8%291,1020.3%+ 0.0%3027
25Daimler Trucks2490.5%– 12.0%241,5590.5%– 8.9%2420
26Mazda2120.4%+ 29.3%281,2840.4%– 4.3%2723
27Changan2040.4%new308190.3%new3341
28Volvo Group2030.4%+ 0.0%271,0430.3%+ 11.6%3129
29BAIC2000.4%– 13.8%311,1570.4%– 15.4%2826
30Honda1910.4%+ 25.7%331,4350.5%+ 27.6%2525
31UD Trucks1820.3%– 7.6%261,1320.4%+ 8.4%2928
32Man1690.3%+ 67.3%328000.3%+ 15.3%3431
33Jaguar Land Rover1550.3%– 47.1%251,3630.4%– 12.1%2621
34Mitsubishi1350.2%– 34.1%341,0040.3%– 1.7%3230
35LDV1210.2%new352520.1%new41 –
36Porsche1210.2%+ 28.7%366190.2%+ 6.4%3533
37Volvo Cars1140.2%+ 119.2%395300.2%+ 14.0%3734
38Sinotruk1120.2%+ 15.5%375680.2%+ 51.1%3636
39Tata1000.2%+ 42.9%403640.1%– 13.3%3935
40Powerstar780.1%– 18.8%385170.2%– 9.3%3832
41Subaru470.1%+ 56.7%412170.1%– 8.4%4237
42Iveco430.1%+ 48.3%451980.1%– 2.5%4339
43VECV South Africa420.1%+ 100.0%422620.1%+ 111.3%4040
44Babcock320.1%+ 128.6%431870.1%+ 81.6%4442
45Shacman320.1%new441560.0%new4543
46Ferrari (Scuderia)60.0%n/a47320.0%+ 14.3%4744
47Proton10.0%– 97.6%46420.0%– 87.2%4638

South Africa June 2026 – models:

PosModelJun-26%/25May2026%/25PosFY25
1Toyota Hilux3,4646.4%+ 14.1%118,8226.0%+ 13.9%11
2VW Polo Vivo2,3954.4%+ 22.1%212,9504.1%+ 14.5%22
3Ford Ranger2,1503.9%– 7.2%312,4724.0%+ 0.6%33
4Chery Tiggo 42,0703.8%+ 34.6%411,3223.6%+ 55.2%48
5Isuzu D-Max1,7243.2%+ 2.7%1110,0683.2%+ 2.3%66
6Hyundai Grand i101,6273.0%+ 9.6%58,9822.8%+ 5.1%77
7GWM Haval Jolion1,4242.6%+ 27.6%77,5882.4%+ 18.8%811
8Suzuki Swift1,3882.5%– 5.3%610,4693.3%– 12.4%54
9Toyota Corolla Cross1,3562.5%– 36.4%87,1412.3%– 25.4%95
10Toyota Urban Cruiser1,1742.2%+ 63.1%n/a4,0161.3%– 5.4%2614
11Suzuki Ertiga1,1502.1%+ 36.9%165,0101.6%+ 15.2%1919
12Suzuki Fronx1,0922.0%– 1.8%96,8742.2%+ 6.3%1010
13Toyota Starlet9681.8%+ 13.6%126,4802.1%– 11.6%119
14Toyota Vitz9211.7%+ 16.0%146,2182.0%+ 75.2%1216
15Jetour T29181.7%new104,9421.6%new16n/a
16Omoda C59011.7%+ 30.0%155,2191.7%+ 45.1%1421
17VW Polo8641.6%+ 14.3%174,7471.5%– 1.3%1817
18Mahindra XUV3X08161.5%+ 71.1%214,4391.4%+ 28.4%2223
19Toyota Fortuner7261.3%– 17.3%234,0921.3%– 3.5%2320
20Mahindra Scorpio Pik Up7011.3%– 18.5%224,6601.5%– 8.2%1718
21Toyota Hiace6561.2%+ 10.1%243,6601.2%– 1.4%2522
22VW T-Cross6191.1%+ 5.3%252,9620.9%– 5.1%2924
23GWM P-Series5651.0%+ 54.0%183,6471.2%+ 78.3%2429
24Toyota Rumion5611.0%+ 49.6%204,1981.3%+ 58.9%2127
25Jetour Dashing5311.0%+ 42.4%422,2220.7%+ 15.1%4034
26Tata Tiago5140.9%new331,6940.5%newn/a –
27Renault Kwid5050.9%– 15.4%302,4430.8%– 20.9%3625
28Renault Triber4980.9%n/a372,9160.9%n/a2737
29VW Amarok4970.9%+ 40.4%322,5010.8%+ 47.1%3436
30Nissan Magnite4820.9%– 37.7%264,2491.3%– 15.6%2015
31Toyota Land Cruiser 704650.9%– 24.4%282,7960.9%– 8.5%3026
32Hyundai i204510.8%+ 62.2%312,8600.9%+ 47.9%2838
33Hyundai Exter4050.7%– 7.5%452,2500.7%– 4.9%3932
34Jetour T13980.7%new292,4710.8%new31n/a
35Toyota Starlet Cross3980.7%– 39.4%134,7271.5%– 9.0%1313
36GWM Haval H63890.7%– 14.7%352,4080.8%+ 28.0%3231
37Suzuki DZire3890.7%n/a41n/an/an/an/an/a
38Ford Everest3800.7%+ 24.2%n/an/an/an/an/an/a
39Chery Tiggo 73650.7%– 9.0%362,1730.7%– 12.5%4235
40Suzuki Baleno3550.7%– 1.4%342,2930.7%– 5.3%3728
41Toyota RAV43550.7%n/an/an/an/an/an/an/a
42BMW X33430.6%+ 1.2%n/an/an/an/an/an/a
43Ford Territory3430.6%+ 19.9%272,2570.7%+ 37.7%3839
44Toyota Prado3070.6%n/a382,3220.7%n/a33n/a
45Suzuki Across2980.5%n/an/an/an/an/an/an/a
46Nissan Navara2940.5%– 27.0%431,9650.6%– 25.3%n/a30
47Renault Kiger2720.5%– 38.0%392,2140.7%– 13.5%4133
48Suzuki Eeco2720.5%n/a47n/an/an/an/an/a
49Peugeot Landtrek2670.5%n/an/an/an/an/an/an/a
50Toyota Land Cruiser FJ2640.5%new  –2640.1%newn/a –

Source: NAAMSA

Leave a Reply

Back To Top